
Figure 5. STN depresses T cell activation in rat in vitro T cell cultures.
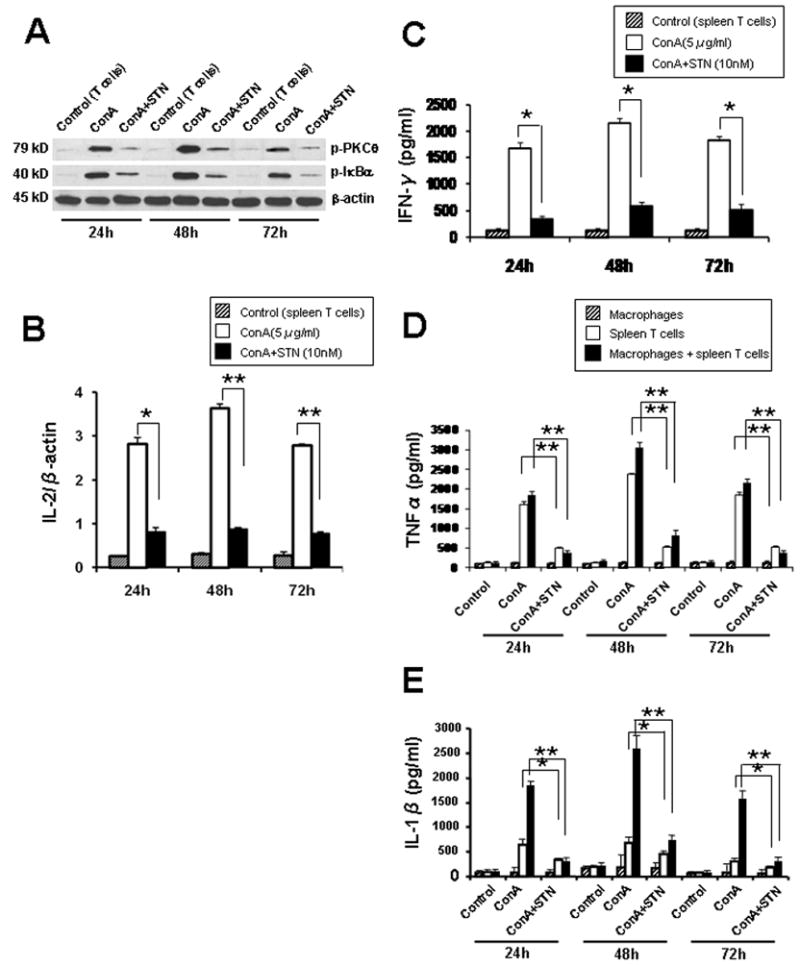
(A) Western blot-assisted phospho-PKCθ and phospho-IκBα expression in ConA-stimulated T cells. Representative of n=3.
(B) Quantitative RT-PCR-assisted detection of IL-2 in Con A-stimulated T cells. *p<0.005, **p<0.001, n=3/group.
(C) IFN-γ production in Con A-stimulated T cells. *p<0.005, n=3/group.
(D–E) TNF-α and IL-1β production in Con A-stimulated T cell - macrophages co-cultures. STN suppressed TNF-α/IL-1β levels. *p<0.05, **p<0.005, n=3/group. No effect of STN on TNF-α/IL-1β in macrophage cultures devoid of T cells.