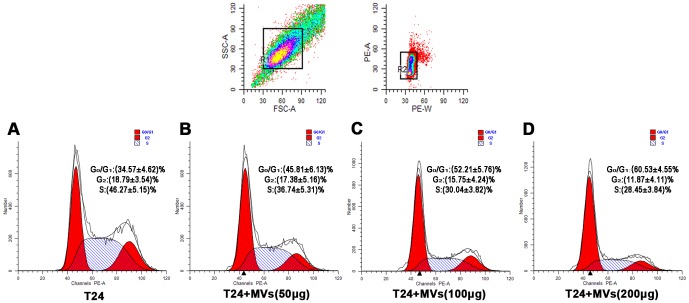
Figure 5. Cell cycle analysis.
Cell cycle analyses were performed after T24 cells were treated with hWJMSC-MVs (0, 50, 100 and 200 µg/ml protein) for 48h. Compared to T24 cells alone (A), hWJMSC-MVs induced a significant increase of T24 cells in G0/G1 phase and a dramatic decrease in S phase (B, C, D, p<0.01). After being exposed to 200 µg/ml protein hWJMSC-MVs, the fraction of T24 cells in G2 phase was greatly decreased (D, p<0.01).

