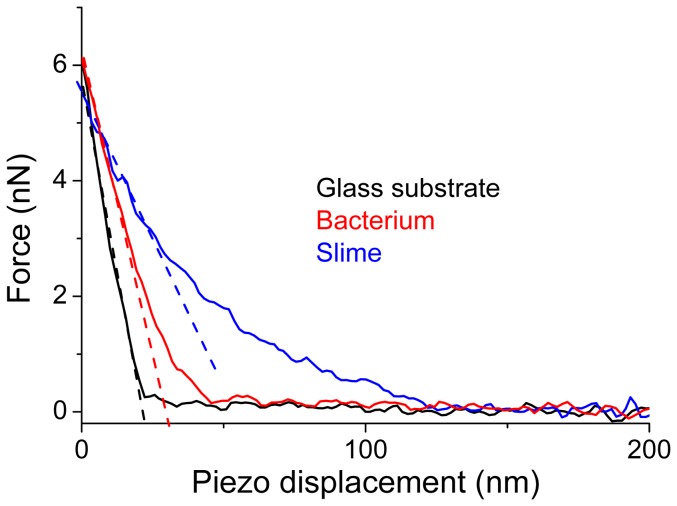
Figure 2. AFM approach curves.
AFM approach curves in MM liquid are plotted for the glass substrate (black line), the Rhodococcus wratislaviensis bacterium (red line) and its slime (blue line). The raw curves have been shifted along X axis to better view the contrast in slopes at the force setpoint. The dashed lines are an illustration of how the effective stiffnesses are calculated from these approach curves (best linear fit for a length window of 10 nm).

