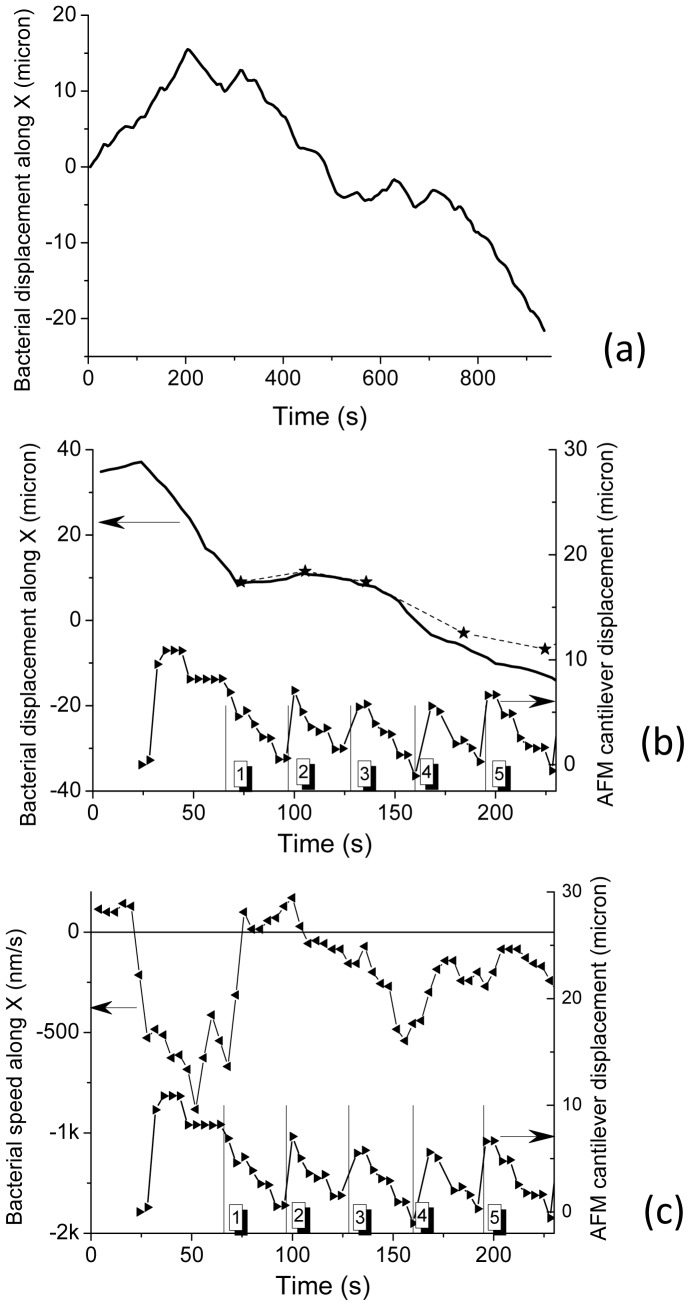
Figure 6. Nostoc displacement and speed curves as measured by optical microscopy.
Figures 6.a–b: The displacement, along the X axis (see figure 5), of a Nostoc bacterium, as determined by optical microscopy, is plotted (full line) versus time during its gliding movement on the surface of the glass slide. The AFM cantilever is 500 nm far from the substrate.Figure 6.b: The displacement along the X axis of another Nostoc bacterium, as determined by optical microscopy, is plotted (full line) versus time. These data are related to the sequence labeled “number 1” in the main text. The AFM tip is now in contact with the substrate and scans it. The AFM fast scan direction is along X. The movement of the AFM cantilever along Y (slow axis) is plotted versus time (black triangles; the line is a guide for the eye): every triangle corresponds to a measured position (one optical image every 4 seconds). The starting times of the successive AFM images are marked by the short vertical segments. The indexation number of the AFM images is labeled in the squared box. The successive X positions of the bacterium as determined from AFM images (see figure 7) are marked by the stars (*), the dashed line being a guide for the eye. The scanning time for a full AFM image is 35 seconds. In figure 6-c (upper curve with left triangles) gliding speed along X axis of Nostoc as calculated from to displacement data in figure 6.b is plotted versus time.

