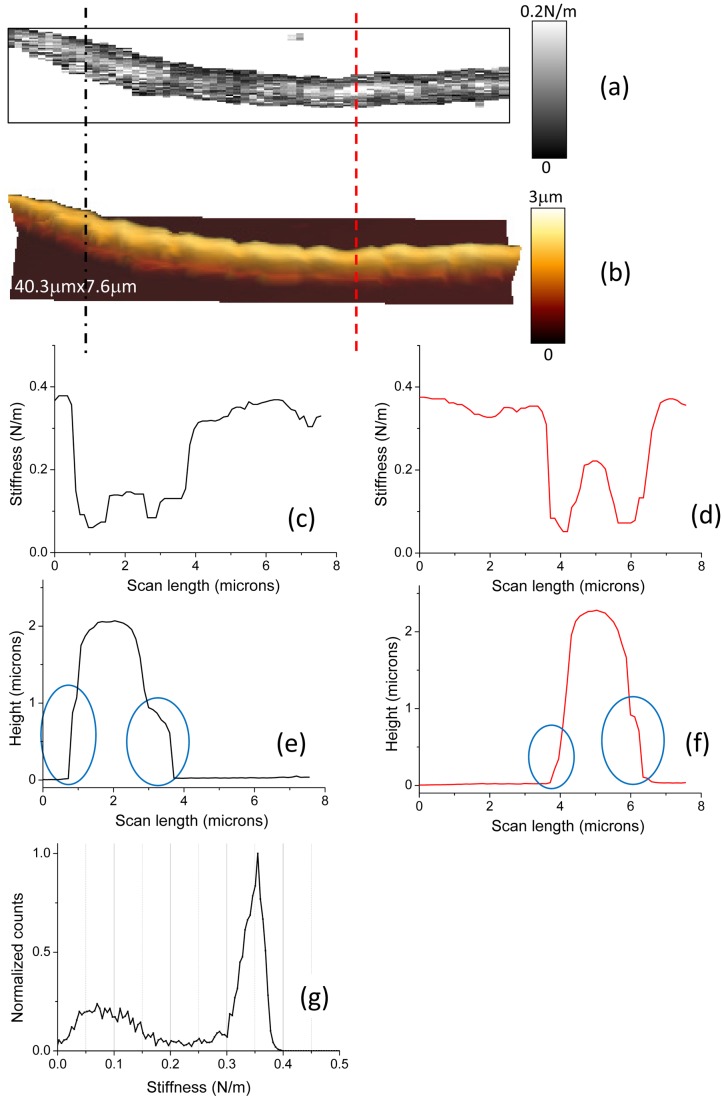
Figure 8. AFM height and stiffness data for Nostoc (sequence #1).
AFM stiffness (a) and height (b) images of Nostoc in its physiological (BG11) medium are shown. They correspond to image 7.5. Stiffness (c) and height (e) profiles along the black dash/dot line in figures (a) or (b) are plotted. Stiffness (d) and height (f) profiles along the red dashed line in figures (a) or (b) are plotted. The blue circles in figures 8.e and 8.f were drawn to point out the presence of ECM at the edges of the Nostoc profile.

