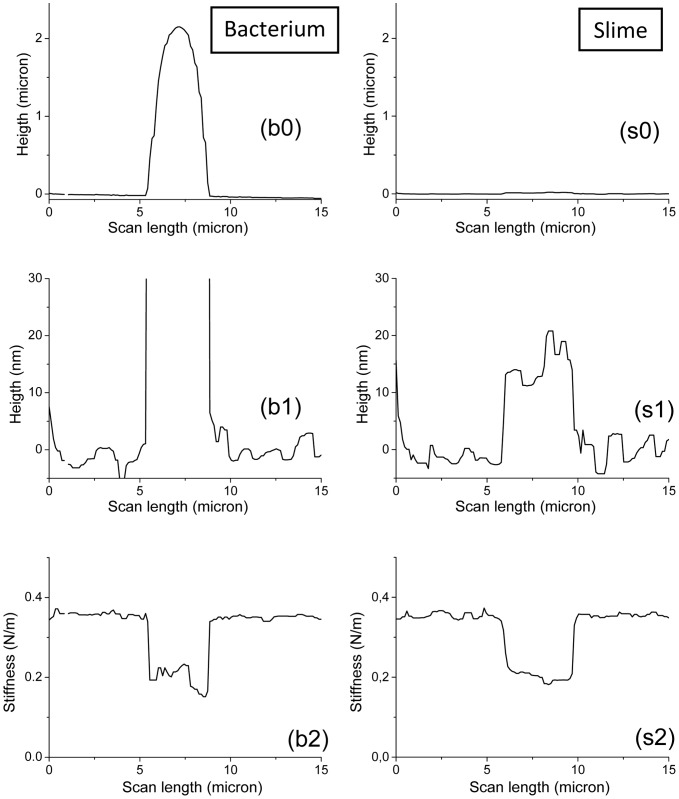
Figure 11. AFM height and stiffness profiles for Nostoc (sequence #2).
AFM height (_0, _1) and stiffness (_2) profiles for Nostoc bacterium (b_) along red line in images 10.b and 12.b and for the excreted slime (s_) along blue line in images 10.c and 12.c are plotted. Height profiles in figures _b0 and _s0 are displayed with the same height scale. Idem for those in figures _b1 and _s1 but with an enhanced contrast.

