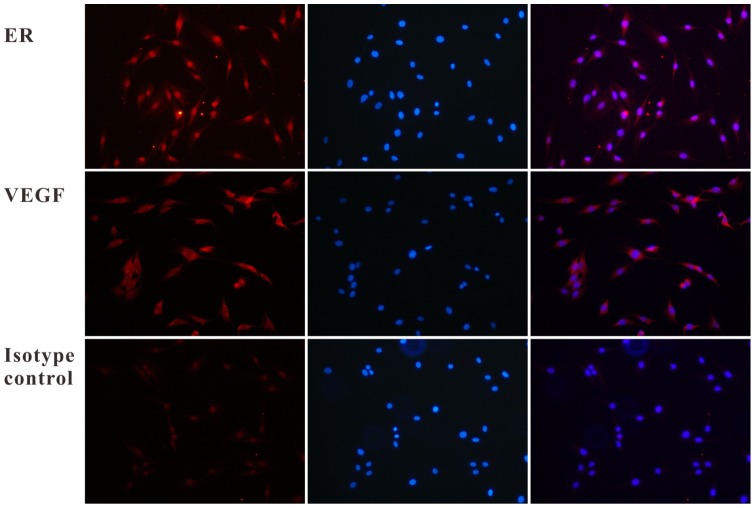
Figure 3. Immunofluorescence results for hERL and VEGF165 expression in Ad-EIV-MSCs (200×).
The upper row showed an intense/moderate immunoreactive signal in the peri-nuclear/nuclear regions, which suggested the expression of the estrogen receptor-α subtype. The image on the left was the positive expression of ER, and the middle one was the nucleus staining under the same field of vision. The image on the right was the overlay image, which showed the sub-cellular localization of ER clearly. The middle row showed an intense immune-reactive signal of VEGF165, which was detected in the cytoplasm. The order of the image was same as the upper row. The third row was the isotype control result.

