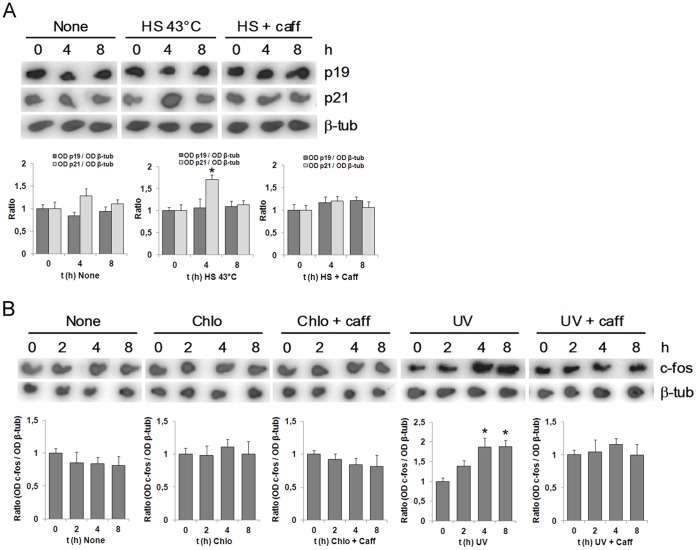
Figure 3. Chromatin relaxation-mediated induction of p19 is specific.
A. HEK-293 cells, previously treated or not with 5 mM caffeine during 1 h, were incubated at 43°C for 1 h and then cultured at 37°C from 0 to 8 h. B. HEK-293 cells, previously treated with 5 mM caffeine for 1 h, were incubated with 100 µM chloroquine at the indicated times. In (A) and (B), cells were harvested and subjected to northern blot analysis using a 32P-labelled probe specified at the right margin. Each figure shows a representative autoradiograph of three independent experiments with similar results. Densitometric analysis of p19, p21 and c-fos are represented in the lower panels. Bars represent the mean ± S.D. of three experiments. Student’s t-test was used to compare samples obtained at different times with samples obtained at zero time (* p<0.05, at least). β-tubulin (β-tub), heat shock (HS), caffeine (caff), chloroquine (chlo).

