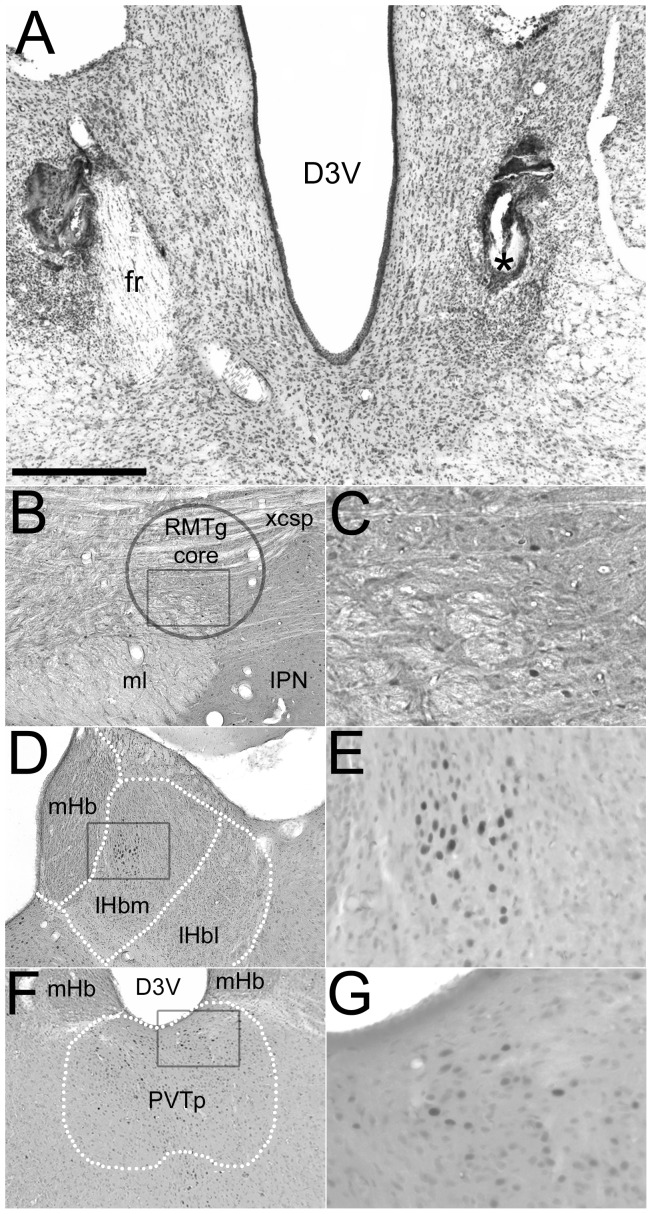
Figure 1. Representative photomicrographs illustrating the effects of low-intensity footshock on the expression of cFos in the RMTg, Hb and PVTp in a sham operated rat.
Cresyl violet stain of a section with an incomplete fr lesion (left) and acceptable lesion (right, *) from an excluded rat (A). cFos expression within the RMTg (B,C), habenula (D,E) and PVTp (F,G). Boxes within the low-magnification micrographs (left) approximate the area of the high-magnification illustrations (right), which show visible cFos positive objects. The RMTg core is the area within the circle (B; for a complete description of RMTg boundaries see [30], [31]). Dotted lines delineate the mHb, lHbm, and lHbl (D) and PVTp (F).Scale bar = 500 µm (A, B, D, F), 125 µm (C, E, G). D3V = dorsal third ventricle, xcsp = decussation of the superior cerebellar peduncle, IPN = interpeduncular nucleus, ml = medial lemniscus,

