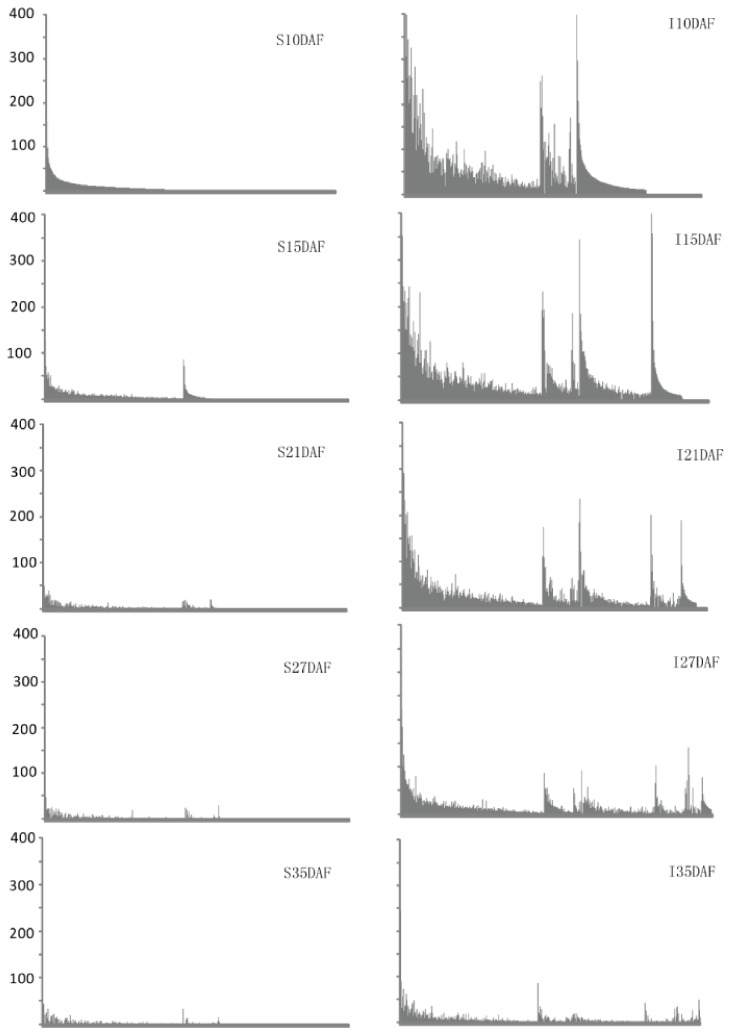
Figure 4. Frequency of 24 nt-siRNAs greater than 10TPM in the superior and inferior grains.
The horizontal axis indicates 24 nt-siRNA, and vertical axis indicates frequency in TPM. The siRNAs were arranged in the same order for the sake of comparison between superior and inferior grains of different stages. S indicates superior grain and I indicates inferior grain. DAF represents day after flowering.

