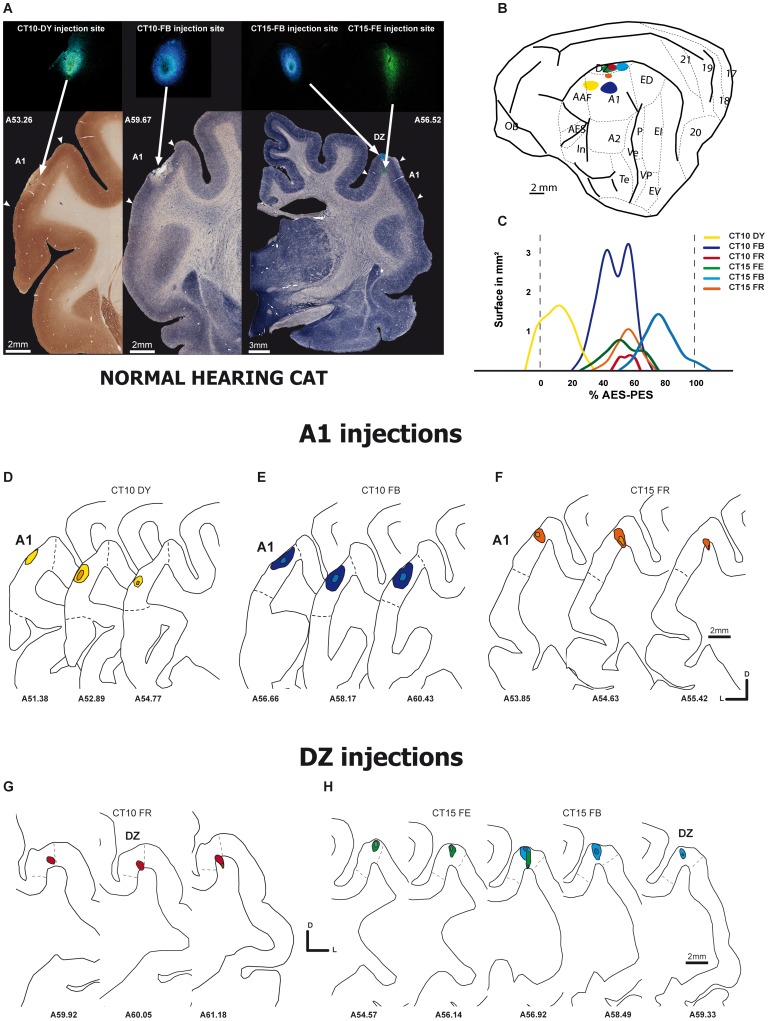
Figure 1. Injection sites in Normal hearing cats.
A. Photomicrographs of frontal sections showing the location of three injections sites in A1 (left and middle panels) and DZ (right panel). The sections were processed for cytochrome oxidase (left panel) or Alkaline phosphatase. B. Schematic view of a cat brain areas. Each blob indicates a single injection located in A1 or DZ. In C are represented the 2D reconstructions of the individual dye injections according to their location (normalized distances) with respect to the distance that separate the anterior and posterior ectosylvian sulci (AES and PES). The color lines represent the antero-posterio extent of the pick-up zone of the retrograde dyes, and each of them (3 injections in case CT10 and 3 injections in case CT15) are represented with a different color. The lower graphs D–H represent the reconstruction on serial sections of the injection sites in A1 (D–F) and DZ (G–H). In each panel the case number are indicated (se table 1). The number of individual sections are indicated and the low to high numbers underneath the sections, represent the antero-posterior location of individual sections.

