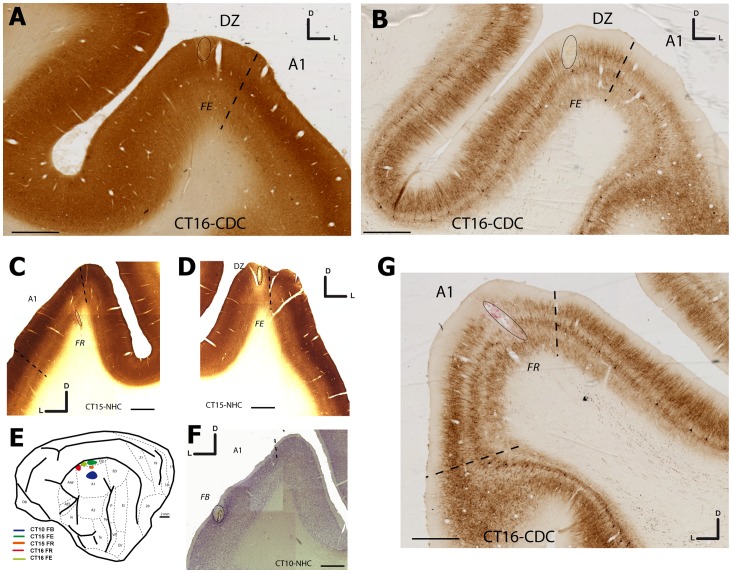
Figure 3. Microphotographies showing the location of the injection sites in A1 and DZ.
In A and B is shown the FE injection in DZ of the deaf cat (CT–16) with respect to the A1/DZ border revealed by cytochrome oxidase (A) and SMI-32 (B). In G is shown the location of the FR injection in A1 on a cortical section reacted for SMI-32. The A1/DZ border is assessed by the presence of a rich neuropile staining in the upper layers of DZ as well as the presence of large reactive cells in layer V [35]. In panels C, D and F are illustrated the location of the injection sites in the NHC in A1 (C and F) or DZ (D) after Nissl (F) or CO staining (C–D). E shows a schematic view of a cat brain in which each blob indicates a single injection illustrated in this figure. Scale bars: 2 mm.

