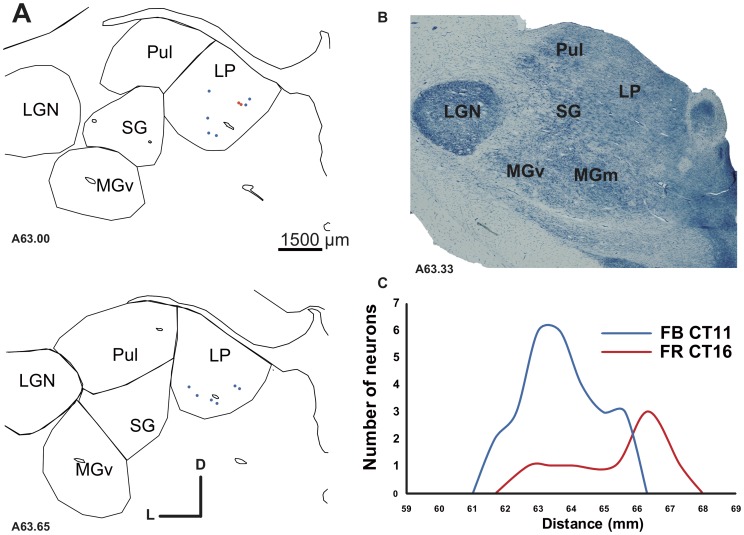
Figure 6. Projection from the Lateral Posterior nucleus (LP) in the deaf cat.
In A is represented the thalamic distribution of labeled cells following two injections in A1 (CT11 FB and DY). B. Alkaline phosphatase staining of an adjacent section. C. Density profiles showing the number of labeled neurons observed on regular serial sections across the LP. The distance axis corresponds to the position of the individual sections on the latero-medial dimension of the brain. The LP projection to A1 is relatively weak, as shown by the paucity of retrogradely number of labeled cells.

