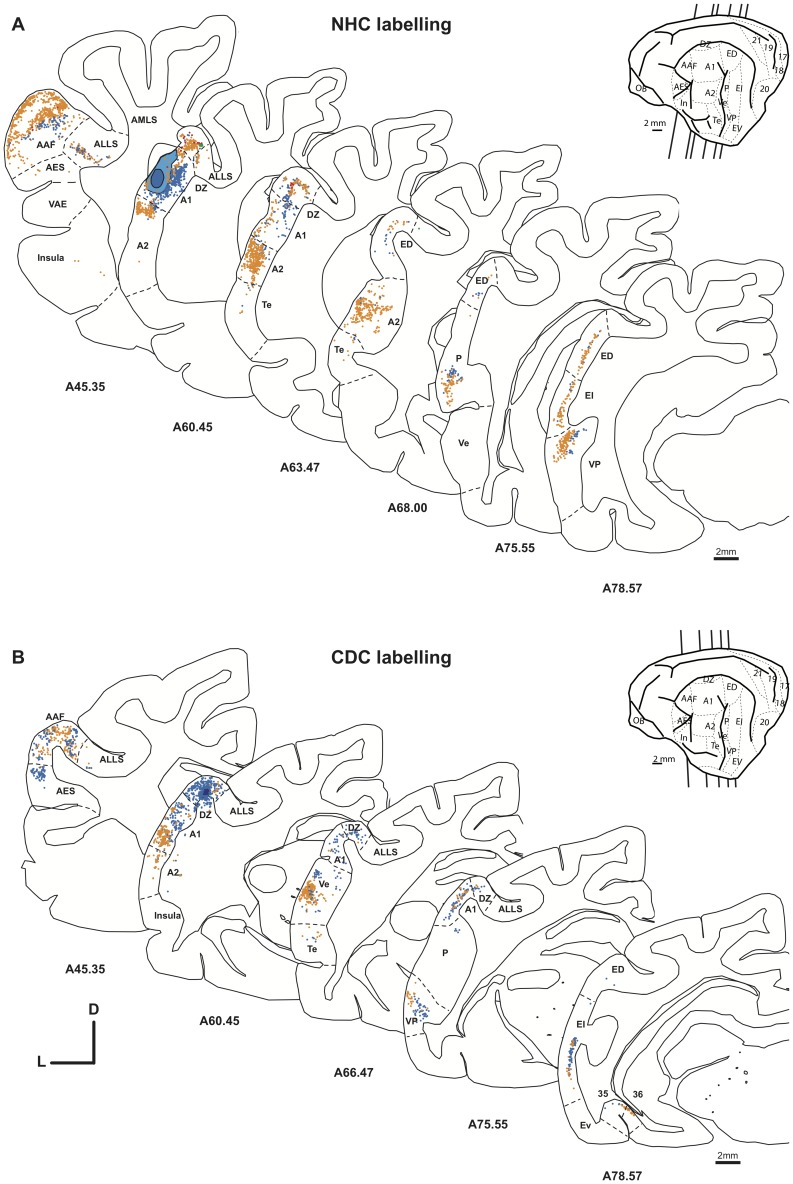
Figure 7. Distribution of the projecting neurons to A1 following a FB (blue) or a DY (yellow) injection in the normal (A, case CT10) and in the deaf (B, case CT11 FB and DY) cat.
Only selected sections are shown to illustrate the distribution of labeled cells in the various auditory areas. The insert shows a schematic view of a cat brain areas and the location of the illustrated sections in the antero-posterior axis. Conventions as in figure 5.

