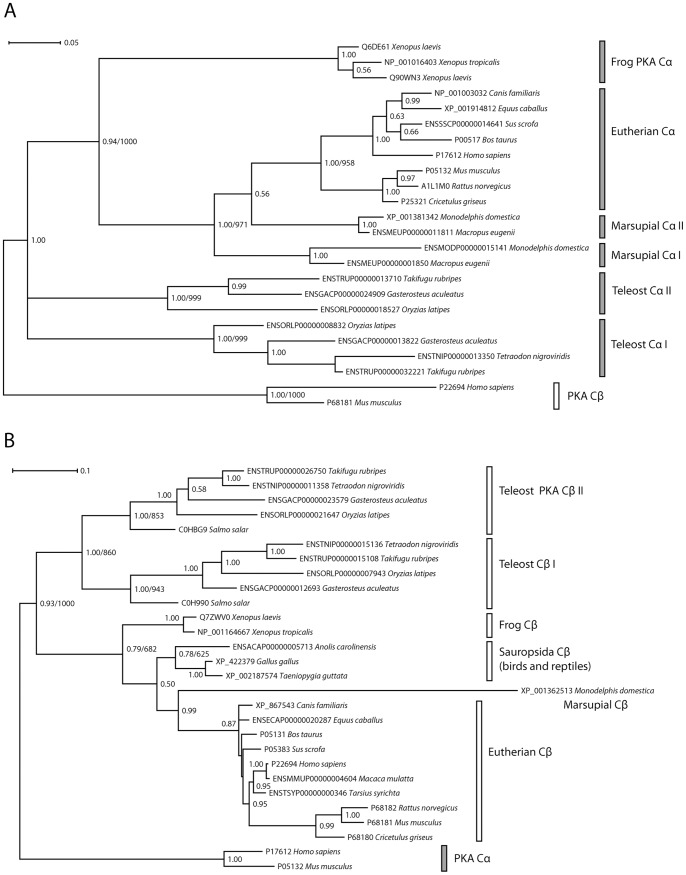
Figure 3. The Bayesian inference trees for vertebrate PKA Cα and Cβ both closely reflects the evolutionary relationships among these organisms.
A Phylogenetic analysis of Cα orthologs resulted in a tree that was rooted with human and mouse Cβ as outgroups. The tree was based on the nucleotide sequences of exons 2 to 8 (all codon positions, GTR+Γ+I model). B Phylogenetic analysis of Cβ orthologs was performed employing nucleotide sequence data (all codon positions, exons 2 to 10, GTR+Γ+I model). The resulting tree was rooted with human and mouse Cα as outgroups. In both trees, branch lengths are shown as substitutions per site, with scale indicated by the scale bars. Bayesian posterior probabilities are given for each node and ML bootstrap values (1000 replications) are shown for selected nodes where the clades are identical in the Bayesian and ML analysis. In addition to organisms found in Fig. 2, representative sequences from the following species were included: eutherian mammals rhesus macaque (M. mulatta), tarsier (T. syrichta), dog (C. familiaris), horse (E. caballus), pig (S. scrofa), cow (B. taurus), rat (R. norvegicus), and hamster (C. griseus), marsupial mammals wallaby (M. eugenii) and opossum (M. domestica), the frog X. laevis, the pufferfish T. nigroviridis and Atlantic salmon (S. salar). See Materials and Methods S1 for the sequence data.

