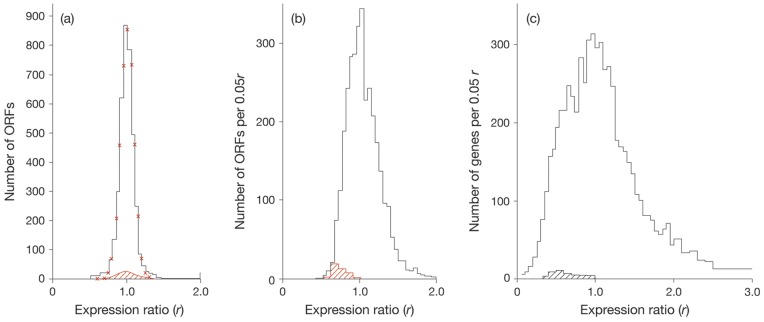
Figure 1. Histograms of expression ratios reported for M.tuberculosis, BCG-Pasteur and Msmeg.
(a) Profile of expression ratios reported for M.tuberculosis grown in rolling bottles. The wild type (the reference culture) was compared with a dosR minus mutant (the experimental culture). Both cultures were found to grow at the same rate (a doubling time of about 17 h). The profile represents 3850 ORFs. The red crosses mark the Gaussian distribution calculated for 3850 expression ratios of r = 1.0±0.09. (b) Profile of expression ratios reported for cultures of BCG-Pasteur grown in a chemostat at growth rates of µ = 0.01 h−1 (the experimental culture) and µ = 0.03 h−1 (the reference culture). A total of 3475 expression ratios were reported [11]; the average value was found to be r = 1.05±0.33. (c) Profile of expression ratios reported for cultures of Msmeg grown in a chemostat at growth rates of µ = 0.01 h−1 (the experimental culture) and µ = 0.15 h−1 (the reference culture). The complete profile comprised 6864 ORFs [12]. In all (a), (b) and (c) the hatched regions refer to 50 ORFs encoding for Zur-independent ribosomal proteins.

