
Figure 3. The relation of the ratios of the specific growth rates (µ′/µ′′) to the ratios of the peptide chain elongation rates (ε′aa(k)/ε′′aa(k)) of ribosomal proteins.
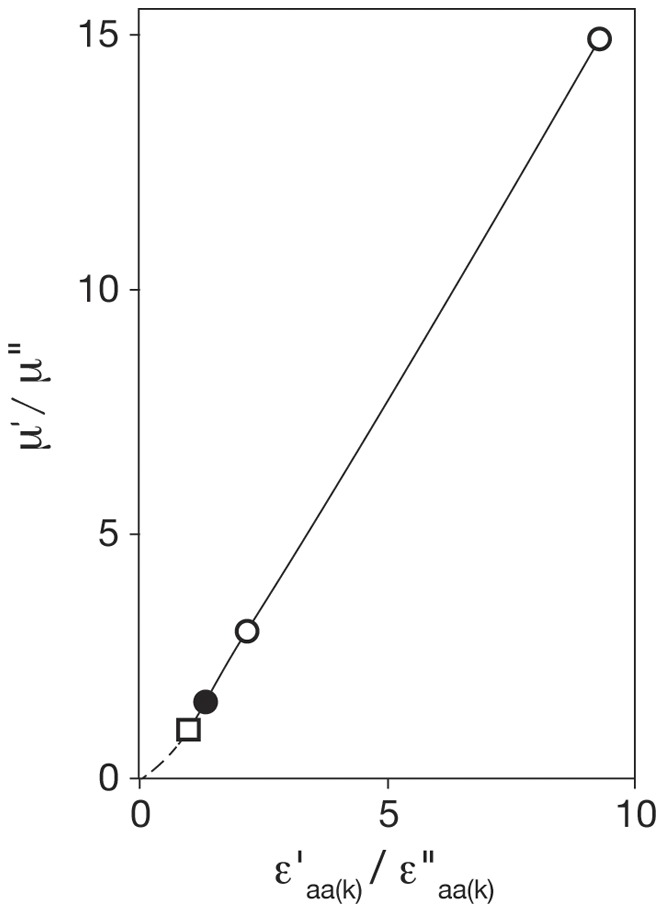
Values of (ε′aa(k)/ε′′aa(k)) were evaluated using equation (9), Table 2. The plot is linear when µ′>µ′′ (see equation (11b), Table 2). The reference point (µ′/µ′′) = (ε′aa(k)/ε ′′aa(k)) = 1.0 is shown as a square; the open circles refer to BCG-Pasteur and Msmeg; the filled circle refers to E. coli B/r (see Table 3, [19]). The broken line applies when µ′< µ′′.