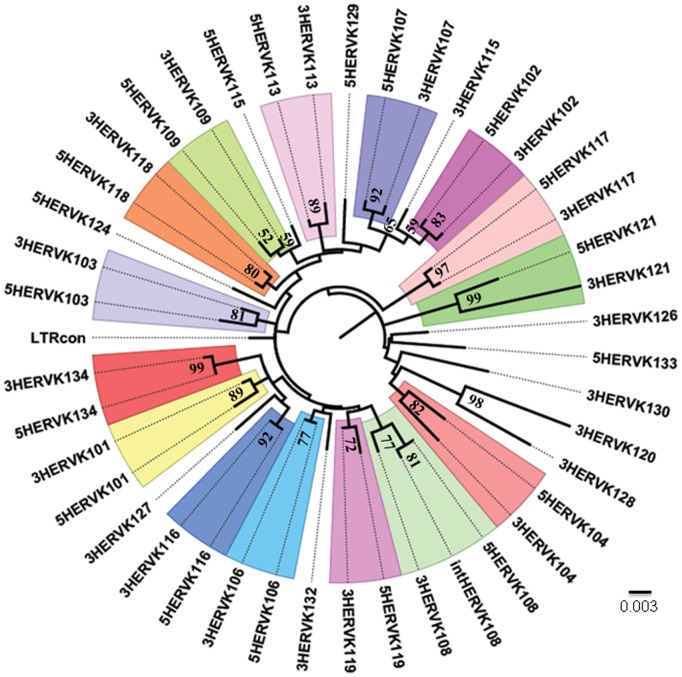
Figure 2. The phylogenetic tree of human-specific HERV-K LTRs.
This is a maximum likelihood tree reconstructed using Kimura-2-parameter distance model. Most HERV-K elements contain an LTR at their 5′ and 3′ ends. In cases where the two LTR sequences are similar to one another, they are shown in the same colour. LTRs from the same element but having divergent sequences are not clustered in the same colour. Short LTRs causing ambiguity on this tree were excluded from this analysis. Bootstrap values for nodes (% of 1000 replicates) scoring higher than 50% are reported.

