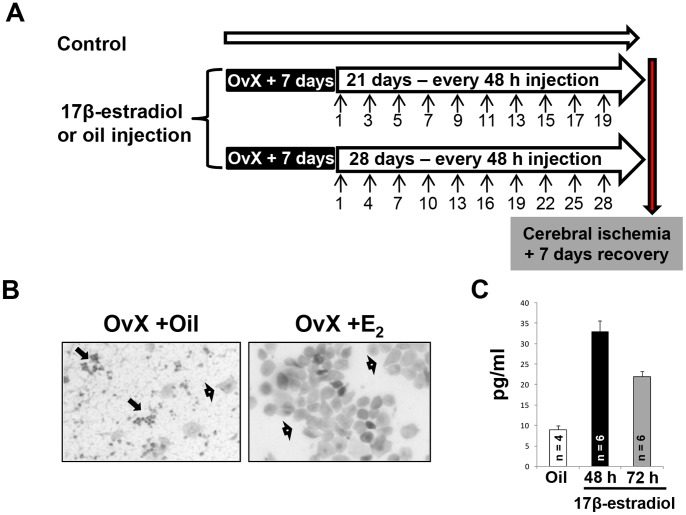
Figure 3. Diagram of experimental design and physiological parameters in periodic 17β-estradiol treated OvX female rats.
(A) The OvX rats were given injections of 17β-estradiol or oil at 48 or 72 h intervals. Arrows indicate days that the rats received injections. Control rats were not OvX and did not receive any injections. (B) Pictures of vaginal histology in oil and E2 treated (48 hr) groups. Arrows show (<$>\raster(70%)="rg1"<$>) neurtrophils and (<$>\raster(75%)="rg2"<$>) superficial (acidophilic and basophilic). (C) The graph represents the plasma E2 levels 48/72 hrs after the last bolus of E2. (D) The graphs depict physiological data and arterial blood gases before and after cerebral ischemia.

