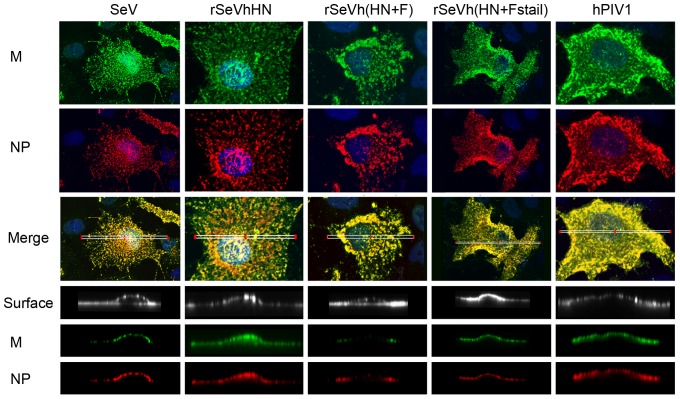
Figure 5. M and NP localization below the plasma membrane of infected cells.
A549 cells were infected with the indicated viruses for 16 h at 34°C. Cells were processed for IF using anti-SeV NP mAb or M rabbit serum. Top 3 panels represent localization of M and NP. Merged images are deconvoluted z-stack images of the xy-plane created using an Olympus FV1000 confocal microcope. Bottom 3 panels show plasma membrane, M and NP and are z-stack reconstructions of the ROIs indicated in the whole cell images by white rectangles in the merged images.

