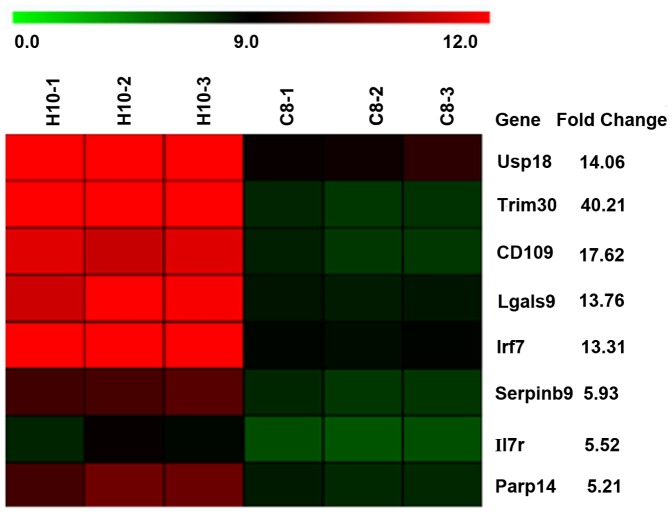
Figure 2. Heatmap of microarray analysis.
Total RNA was extracted from H10 and C8 cells undergoing day 2 of RANKL-induced OCG. Microarray analysis was performed with an Affymetrix array and genes with a FDR of 0.01 and fold change over 5 were selected. Heatmap showing 8 randomly selected genes for RT-qPCR confirmation, that have not been reported to be involved in OCG.

