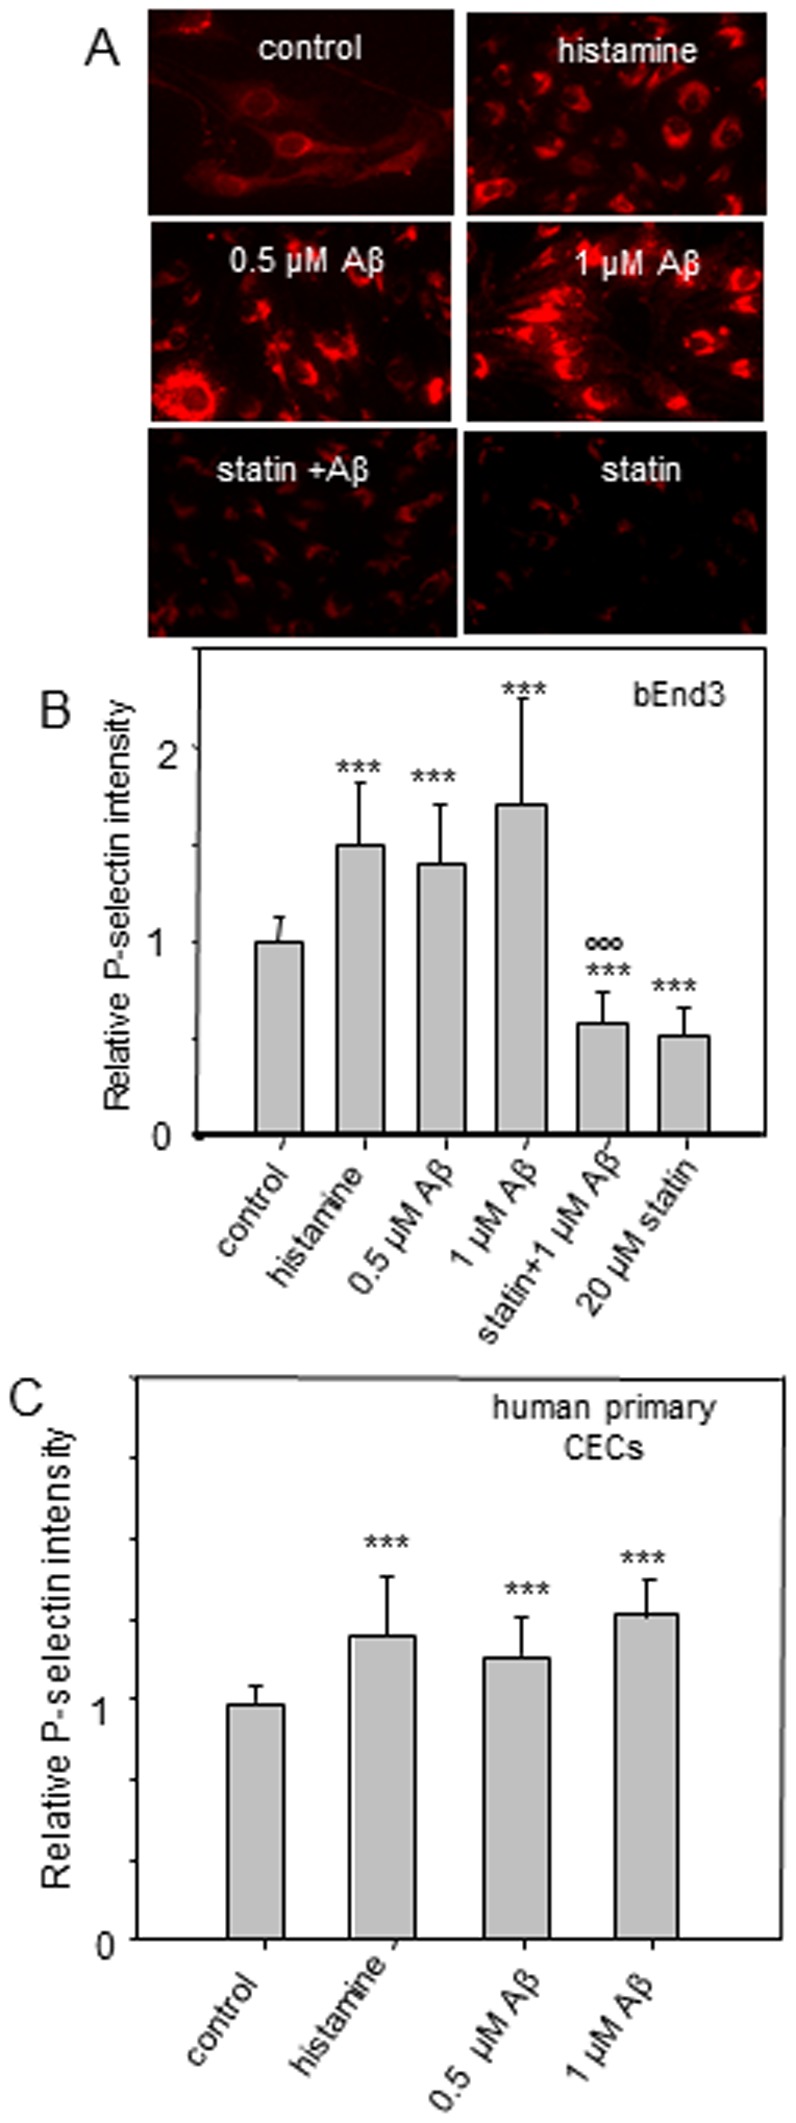
Figure 3. Effects of Aβ, histamine, and lovastatin on P-selectin expression at the CEC surface.

(A) Fluorescent micrographs of fluorescently-labeled P-selectin at the bEnd3 cells. (B) Relative P-selectin intensity at the bEnd3 cell surface and (C) the human primary CEC surface. ***p≤0.001, **p≤0.01 compare to the control; °°° p≤0.001 compare to the Aβ (1 µM) treatment group.
