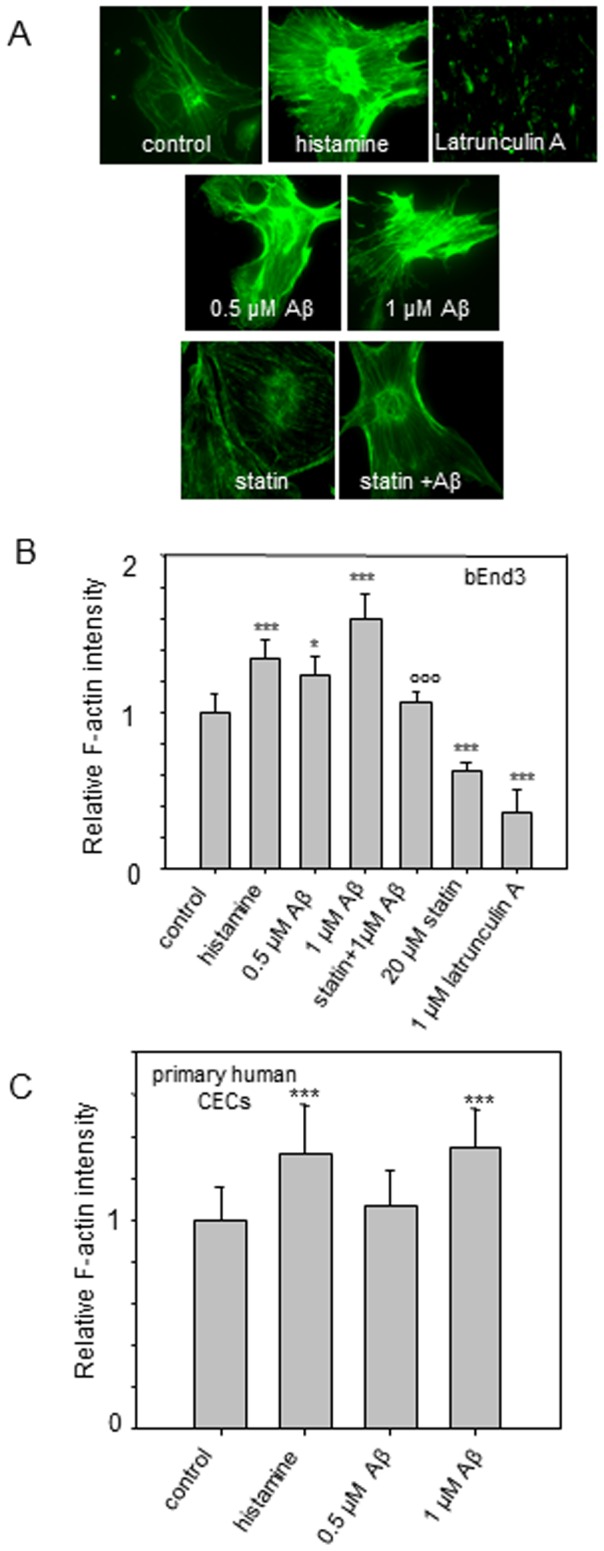
Figure 4. Effects of Aβ, and histamine on actin polymerization in CECs.

(A) Fluorescent micrographs of Oregon-green phalloidin-labeled F-actin in bEnd3 cells. (B) Relative F-actin intensity in bEnd3 cells and (C) primary human CECs. ***p≤0.001, ** p≤0.01, * p≤0.05 compare to the control; °°° p≤0.001 compare to the Aβ (1 µM) treatment group.
