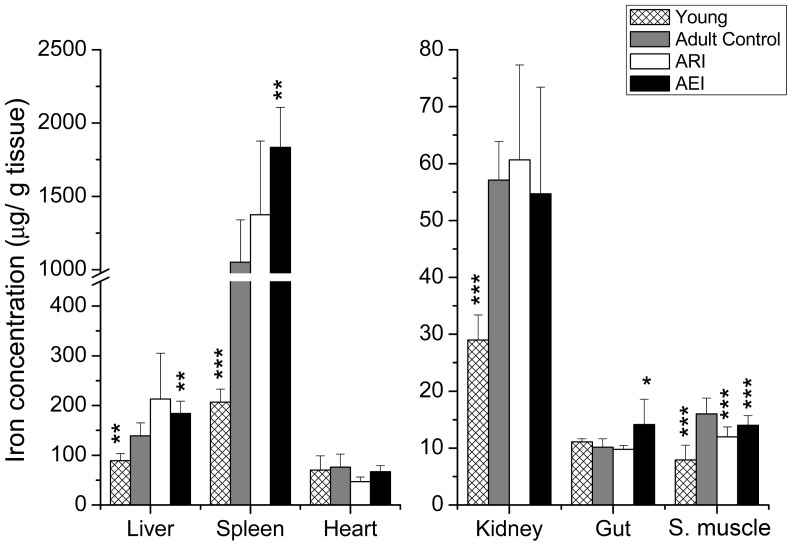
Figure 1. Concentration of iron in the tissues of adult rats treated with control and restricted-iron (ARI) or enriched-iron (AEI) diets and of young rats (µg of iron/g tissue).
Average and standard deviation: n = 7 (CT); n = 5 (ARI); n = 8 (AEI); n = 6 (young). Difference between control group and test groups: *p≤0.05; **p≤0.01; ***p≤0.001 (Student's t-test).

