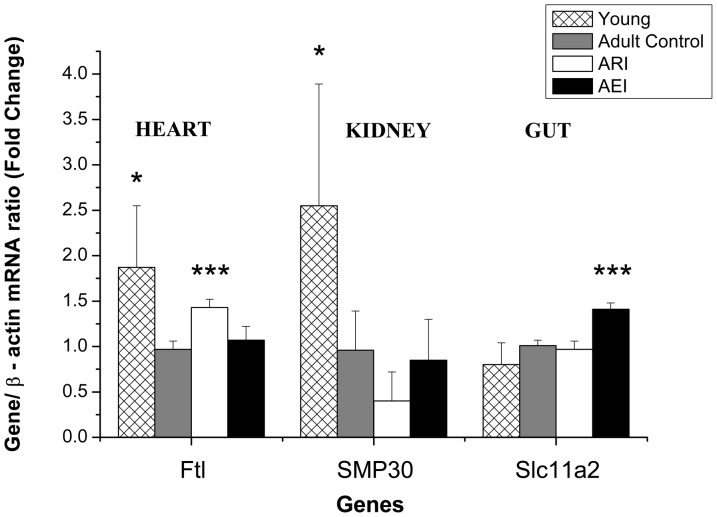
Figure 3. Quantification of Ferritin (Ftl) mRNA from heart tissue, SMP30 mRNA from kidney tissue and divalent metal transporter-1 (Slc11a2) mRNA from gut tissue of adult rats treated with control and restricted-iron (ARI) or enriched-iron (AEI) diets and of young rats (Gene/b-actin mRNA ratio - fold change).
Average and standard deviation: n = 7 (CT); n = 5 (ARI); n = 8 (AEI); n = 6 (young). Difference between control group and test groups: *p≤0.05; **p≤0.01; ***p≤0.001 (Student's t-test). RT-PCR analyses were normalized against the mRNA expression of the housekeeping gene (β-actin gene) in the same tissue sample and then expressed as the “test/control” ratios.

