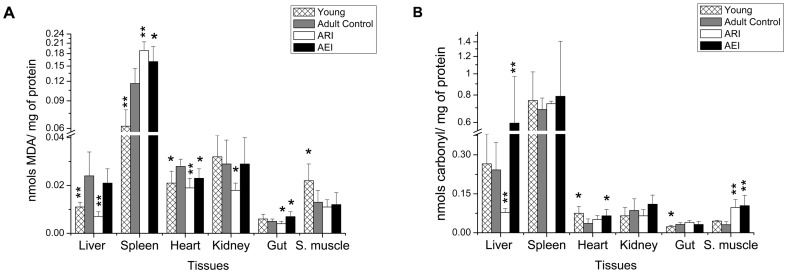
Figure 5. Malondialdehyde (MDA) (A) and protein carbonyl concentration (B) in liver, spleen, heart, kidney, gut and skeletal muscle homogenates of young rats and adult rats treated with control and restricted-iron (ARI) or enriched-iron (AEI) diets (nmols MDA/mg of protein and nmols carbonyl/mg of protein).
Average and standard deviation: n = 7 (CT); n = 5 (ARI); n = 8 (AEI); n = 6 (young). Difference between control group and test groups:*p≤0.05; **p≤0.01; ***p≤0.001 (Student's t-test).

