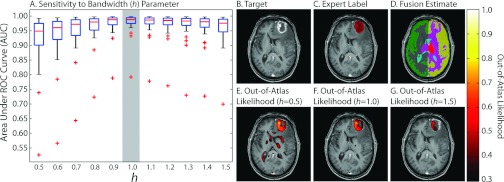
Figure 4.

Sensitivity of the approach to the bandwidth parameter. The spread of AUC values across the 30 subjects for various bandwidth values is seen in (a). Note that the optimal value is approximately 1.0, which is not surprising given the intensity normalization procedure. (b)–(g) Qualitative results are presented with various out-of-atlas likelihood estimations for varying bandwidth values presented in (e)–(g).
