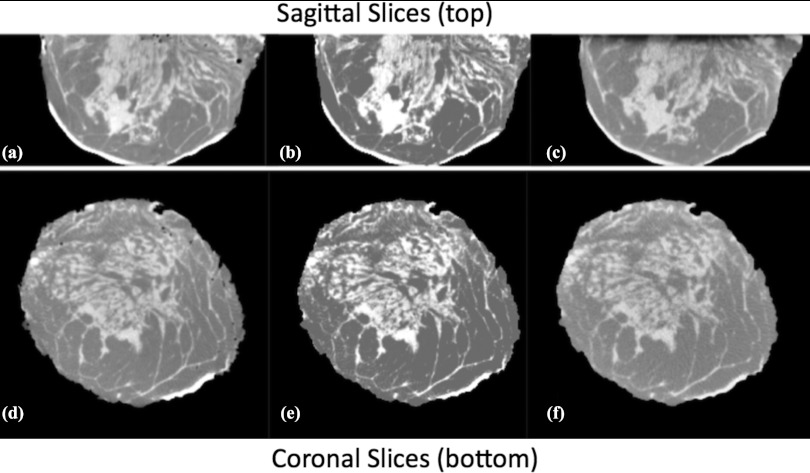
Figure 12.
Representative sagittal (top) and coronal (bottom) slices. (a) and (d) are from a mastectomy specimen reconstruction (basis for digital phantom). (b) and (e) show corresponding slices from resultant digital phantom (using the multivalue model). (c) and (f) show slices from a computer simulation made using this digital phantom (i.e., generating simulated projections followed by FBP reconstruction). The simulation technique used was: 40 kVp, 4 mGy mean glandular dose for 300 simulated projections with simulated detector characteristics similar to prototype detector. Note the visual similarity between simulated reconstructions, (c) and (f) and the original specimen reconstruction, (a) and (d). A postreconstruction ADF was applied to the simulation. [Note: display windows are not uniform.]

