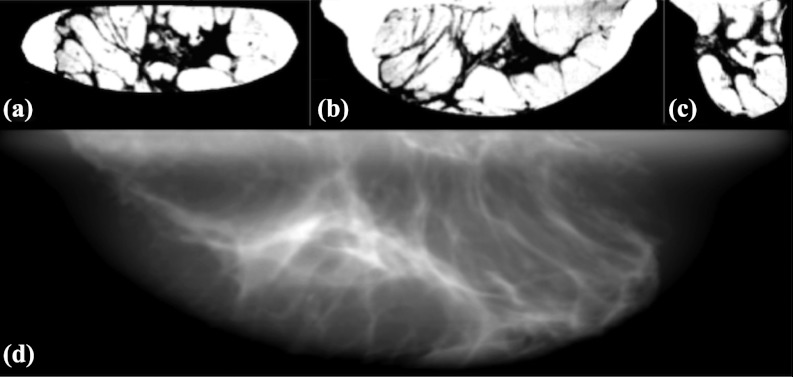
Figure 13.
A, B, and C are coronal, axial, and sagittal slices, respectively, of a pseudocompressed phantom. The phantom displayed as a “negative” (i.e., adipose tissue values bright and glandular values dark). D is a simulated mammogram using this pseudocompressed phantom. The simulation technique used was Mo/Mo 30 kVp spectra at 1.5 mGy mean glandular dose with simulated detector characteristics of 100 μm2 pixel and CsI detector thickness of 100 μm.

