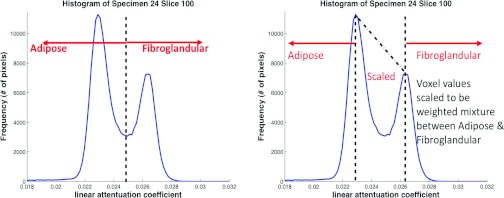
Figure 5.

Illustration of two methods for classifying voxel values. On the left is the binary method (voxels are classified as either adipose or fibroglandular). On the right is the multivalue method in which all values to the left of the adipose peak are assigned as adipose tissue and all to the right of fibroglandular peak are assigned as fibroglandular tissue. The values between the peaks are scaled linearly as some combination of adipose and fibroglandular tissue.
