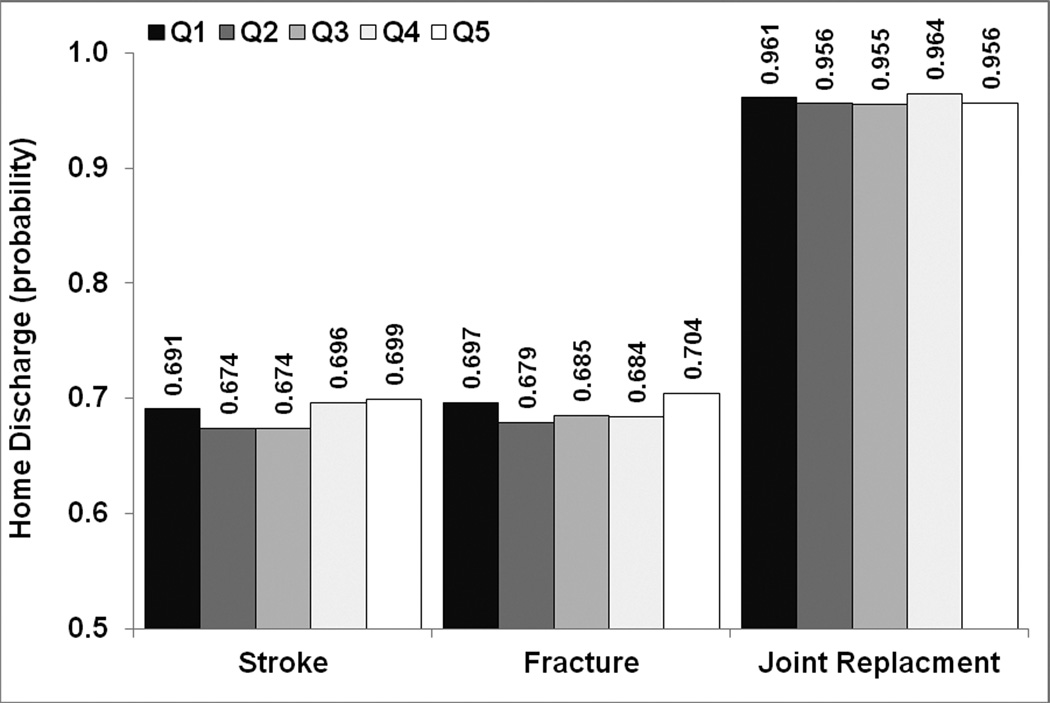
Figure 4.
Predicted home discharge probability by diagnosis-specific volume quintiles. The values were obtained from hierarchical generalized linear models and represent the predicted probabilities for white, female patients with average clinical characteristics (age, comorbidity burden, duration to admission, admission functional status, and length of stay) within each of the three diagnosis categories. Sample sizes increase across quintiles and vary by diagnosis: stroke 12,867 (Q1) – 83,567 (Q5), fracture 5,609 (Q1) – 59,511 (Q5), joint replacement 4,326 (Q1) – 79,831 (Q5), see Table for more details. Reference category = Q3 for all tests of significance, none of which reached p < .01.

