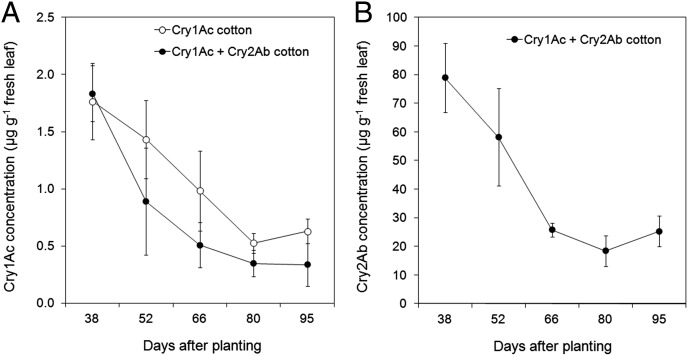
Fig. 4.
Concentration (±95% CI) of (A) Cry1Ac and (B) Cry2Ab in fresh terminal leaves of cotton producing only Cry1Ac (DP 448 B) and cotton producing Cry1Ac and Cry2Ab (DP 164 B2RF). Thirty-eight, 52, 66, 80, and 95 DAP correspond to presquaring, squaring, early fruiting (first flower), fruiting, and late fruiting stages of cotton, respectively. Least squares means toxin concentration and associated 95% CI for each cultivar and date were obtained from ANOVA.

