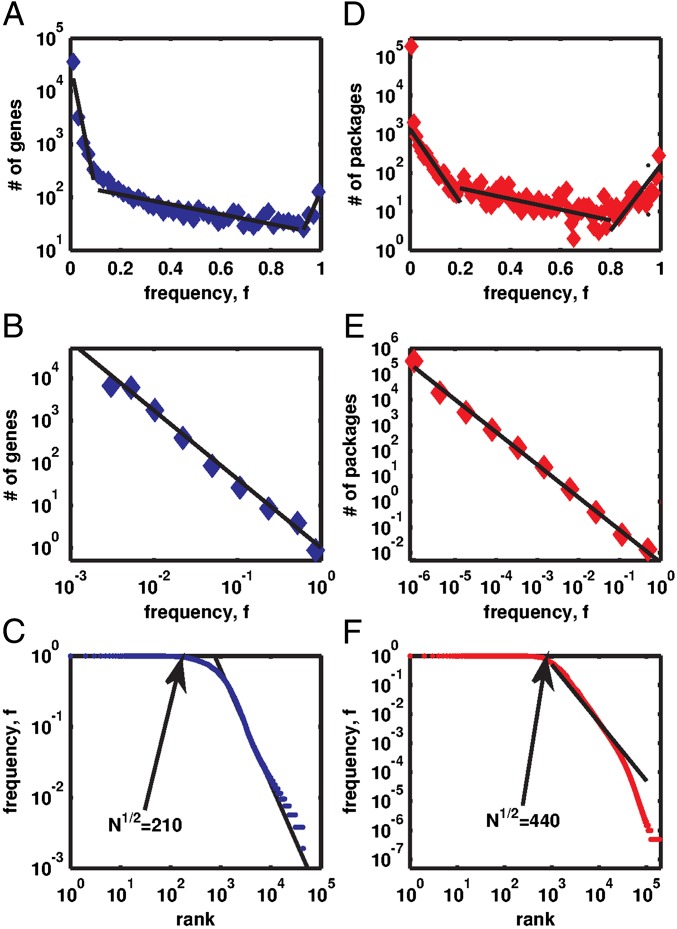
Fig. 1.
The histogram P(f) of the frequency f of bacterial genes present in genomes (A) or Linux software packages installed on computers (D) in semilogarithmic coordinates. Dashed lines show a piecewise linear fit used to define core (f > 0.95), character (0.95 ≥ f > 0.1), and accessory (f ≤ 0.1) components (1, 16). When plotted in log-log coordinates (B for genes and E for Linux), the histogram is consistent with the power law P(f) ∼ f−γ with the exponents γGenomes = 1.62, and γLinux = 1.42 (solid lines in B and E). In rank-frequency Zipf’s plots (C for genes and F for Linux), core components manifest themselves as plateaus at f ∼ 1. Straight lines in C and F are the best power-law fits used to determine γGenomes,γLinux, and the arrows point to  —the mathematically predicted number of core components.

