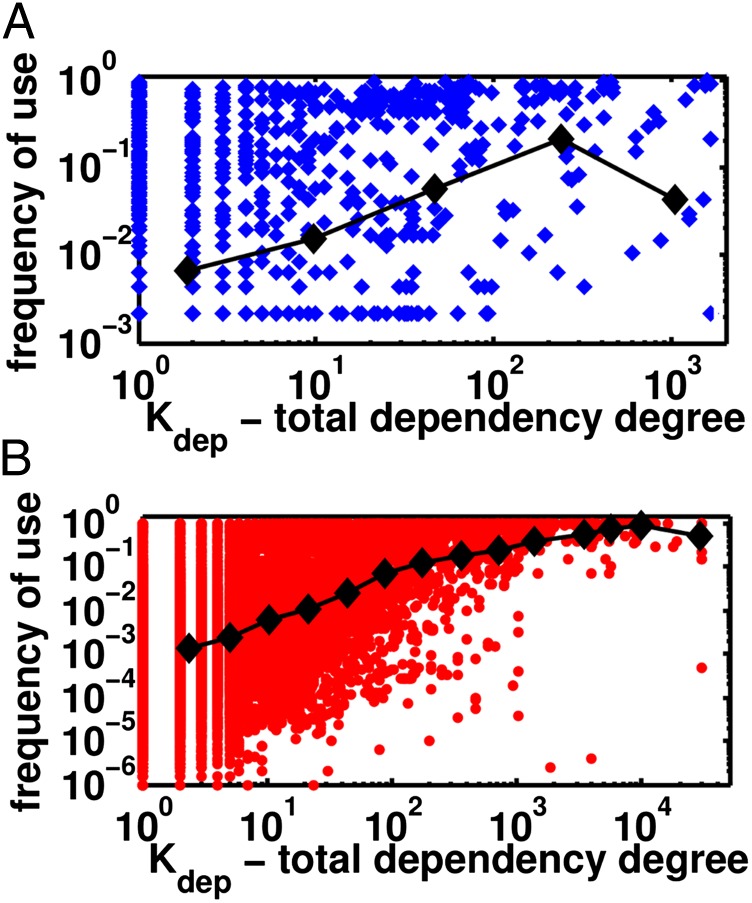
Fig. 2.
Components’ frequencies f (y axis) are positively correlated with their total (direct + indirect) dependency degrees Kdep (x axis) for both metabolic enzymes (A) (Spearman’s rs = 0.30) and Linux packages (B) (Spearman’s rs = 0.47). The black lines and symbols show the geometric averages of f in each logarithmic bin of Kdep.

