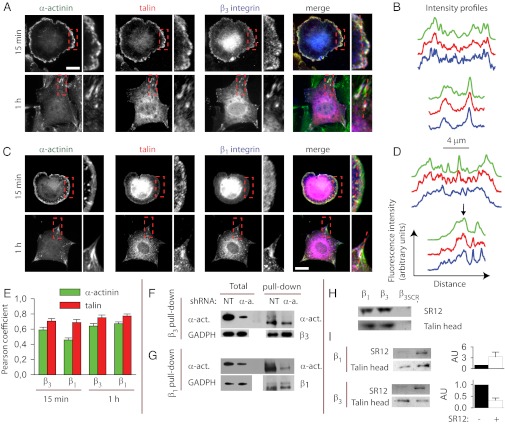
Fig. 4.
α-Actinin and talin compete for binding to β3 integrins. (A) Localization of α-actinin, talin, and β3 integrins in cells spread for 15 min or 1 h. Merged images show α-actinin in green, talin in red, and integrins in blue. White areas denote colocalization of all three proteins. Expanded views amplify the areas marked with a red rectangle. (B) fluorescence intensity profiles (arbitrary units) across the red dotted lines shown in the corresponding zoomed view. Profiles of α-actinin, talin, and β3 integrins are shown respectively in green, red, and blue. (C and D) Same as A and B with β1 instead of β3 integrins. (Scale bars in A and C, 20 µm.) Colocalization of β1 integrins with talin and α-actinin was not clearly observable after 15 min. After 1 h, colocalization was clear for large focal adhesions (black arrow in D) but not for smaller adhesions (peaks to the right of black arrow). (E) Pearson coefficients quantifying the colocalization between talin and α-actinin to β3 and β1 integrins in staining images (1 = perfect overlap, 0 = unrelated distributions). Colocalizations with integrins were higher for talin than α-actinin (P < 0.001). For α-actinin, colocalization at 15-min spreading with β1 integrins was significantly lower than at 1 h (P < 0.01). n ≥ 6 cells measured on two diferent days. (F and G) Pull-down with β3 antibody (F) or β1 antibody (G) of lysates from cells transfected with NT or α-actinin shRNA. Lanes labeled as total show the lysate before pull-down (8× dilution), whereas lanes labeled as pull-down show the pulled-down proteins. (H) Talin head and α-actinin SR12 fragment were incubated with beads coated with β1, β3, and scrambled β3 (β3SCR) integrin cytoplasmic tails. The amount of talin head and SR12 (1 μM) bound to integrins was then assessed by protein staining after a pull-down assay. (I) Talin head (1 μM) was incubated with beads coated with β1 or β3 tails (Upper and Lower, respectively) either in the absence or in the presence (5 μM) of SR12. Amounts of talin head and SR12 were then assessed as in (H). Quantifications (to the right of each blot) show the average amounts of talin head in arbitrary units (AU), where the value for the case with no SR12 (−) is set to 1 (n ≥ 3).

