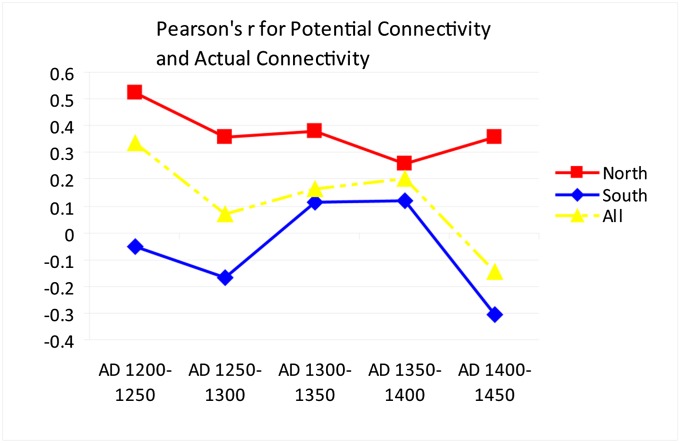
Fig. 3.
Pearson’s r between potential connectivity (based on distances modeled by friction surfaces shown in Fig. S2) and actual connectivity based on ceramic similarity scores. Relatively little social connectivity can be accounted for by spatial propinquity. The relationship is highest early on, and only for the north, illustrating how much long-distance ties make up the relationships among sites in both northern and southern networks.

