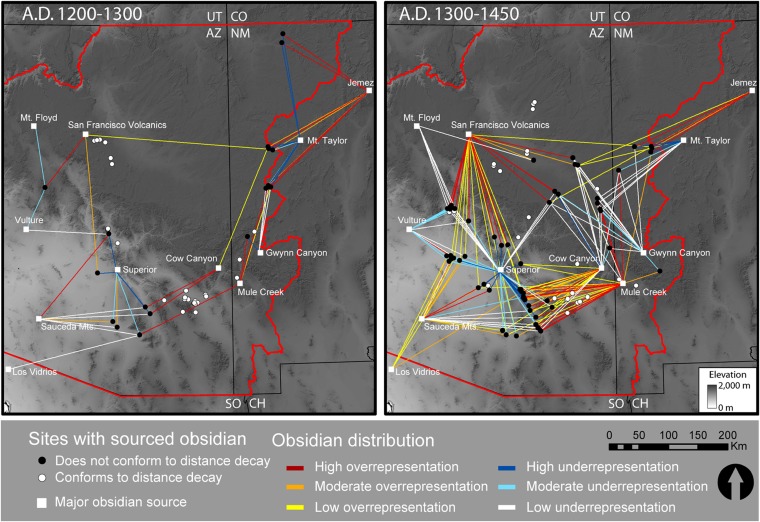
Fig. 4.
Maps showing sites that do or do not deviate from expected patterns of obsidian procurement based on a gravity distance decay model before (A.D. 1200–1300) and after (A.D. 1300–1450) the major period of migration. Lines connecting known obsidian sources to deviating sites are color coded to indicate varying degrees of source over- or underrepresentation with respect to expected obsidian frequencies (SI Materials and Methods).

