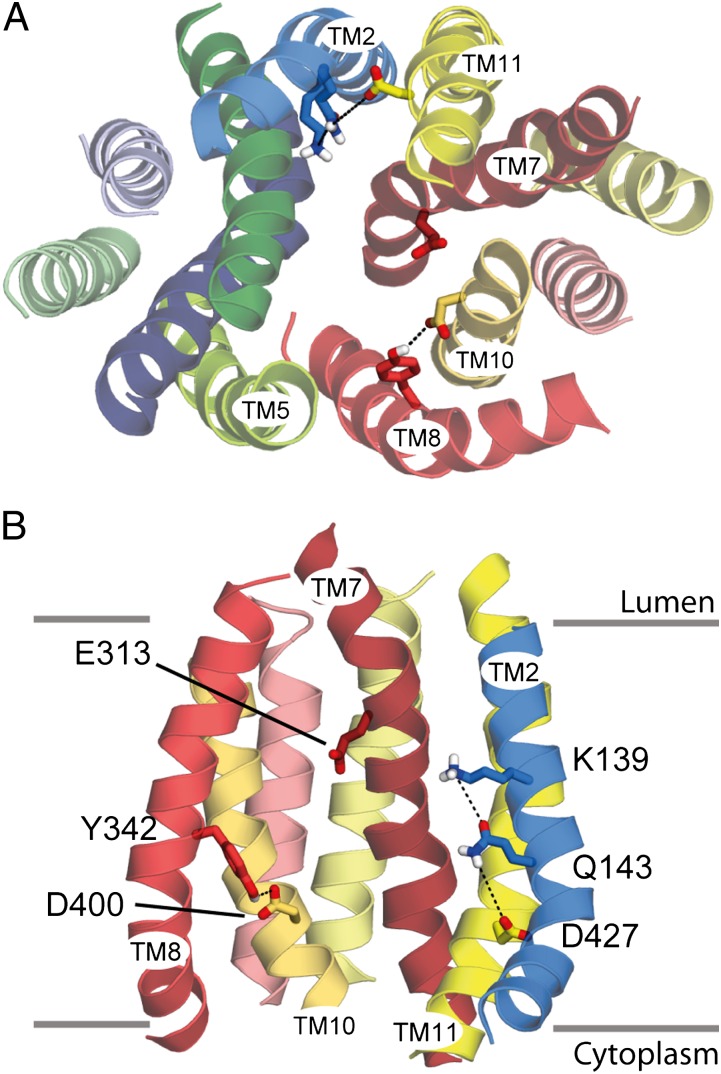
Fig. 2.
Model of the cytoplasm-facing conformation of rVMAT2. The transporter is shown as helical cartoons, viewed from the cytoplasm (A) or from the plane of the membrane showing only the C-terminal domain and TM2 (B). Side chains of key residues are shown as sticks. Predicted interactions between residues are shown (dashed lines). Approximate boundaries of the membrane are shown as gray lines.

