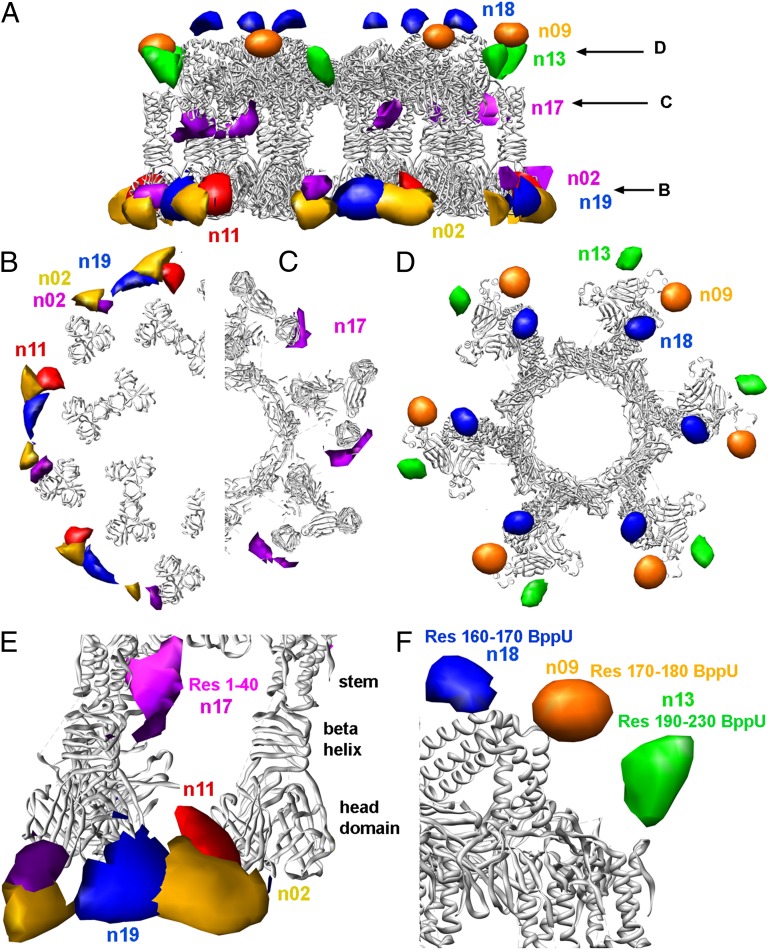
Fig. 5.
Negative staining single-particle EM analysis of the binding of the various nanobodies to the BPTP901-1. (A) The ribbon view of the BPTP901-1 X-ray structure (6) and the difference maps calculated for nanobodies 2, 11, 17, and 19 (anti-BppL) and nanobodies 9, 13, and 18 (anti-BppU). (B) Section observed at the level of the BppU/BppL junction. (C) Section observed at the level of the BppL head domain. (D) Section observed at the level of the BppL stem domain. (E) Close-up view of the BppU/BppL junction. (F) Close-up view of the BppL area.

