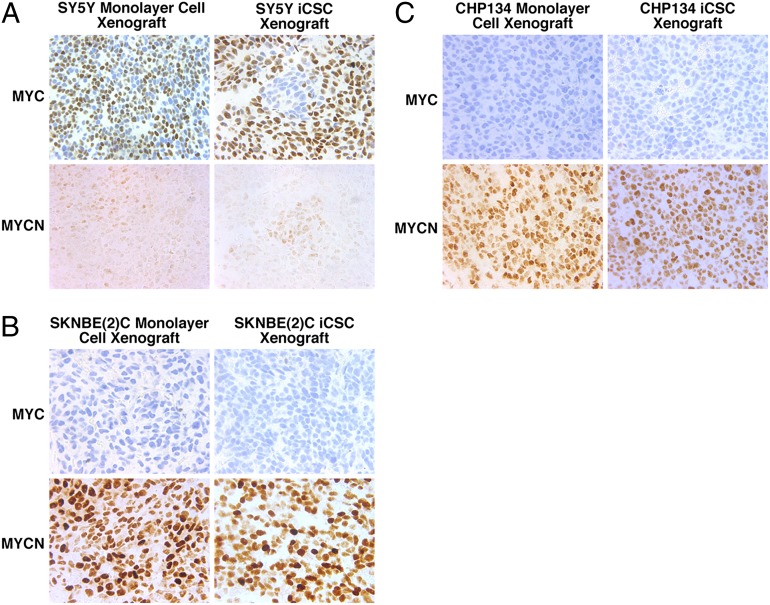
Fig. 7.
MYC and MYCN expression in NB monolayer cell and iCSC xenografts. (A) In the SY5Y monolayer cell xenografts, the majority of MYC-expressing cells were intermingled with the minority of MYCN-expressing cells. In the SY5Y iCSC xenografts, MYC-negative cells were, in fact, MYCN-expressing cells, which formed small islands in the majority of MYC-expressing cells. (B and C) SKNBE(2)C and CHP134 were MYCN-amplified cells and uniformly expressed high levels of MYCN in both monolayer cell and iCSC xenografts. The procedures used are described in Fig. 5. Microscopic magnification of 400× was used for all pictures.

