
Fig. 1.
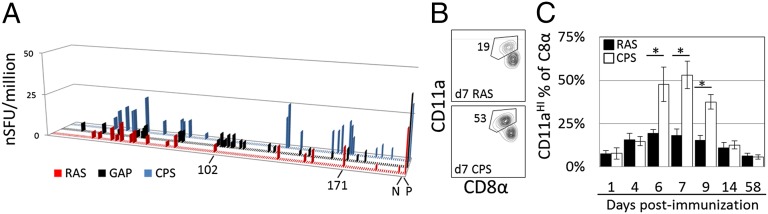
Different sporozoite immunizations result in CD8+ T-cell responses that vary in magnitude and diversity. (A) Normalized HTS results from primary immunization with RAS (red), CPS (blue), and GAP regimens (black). Data are the mean normalized IFNγ spot count per well for 199 screening pools based on duplicate screening wells at 95% confidence. The x axis displays pools 1–199 in numerical order followed by control wells, as indicated. Pools 102 (containing a CSP epitope) and 171 and negative (N) and positive (P) controls are indicated. (B) Flow cytometry of peripheral blood leukocytes 6 d after immunization with 2 × 10⁴ RAS or CPS parasites, assessing CD11a and CD8α to identify P. yoelii sporozoite-induced CD8+ T cells. Values adjacent to gated regions indicate percent of CD11aHICD8aLO cells of all CD8+ T cells. (C) Average percentage of CD11aHICD8αLO cells of all CD8+ T cells at the times after immunization. *P < 0.0001 (two-way ANOVA); error bars, 95% CI, n = 9 mice per group; representative of two experiments. Filled bars, RAS; open bars, CPS.