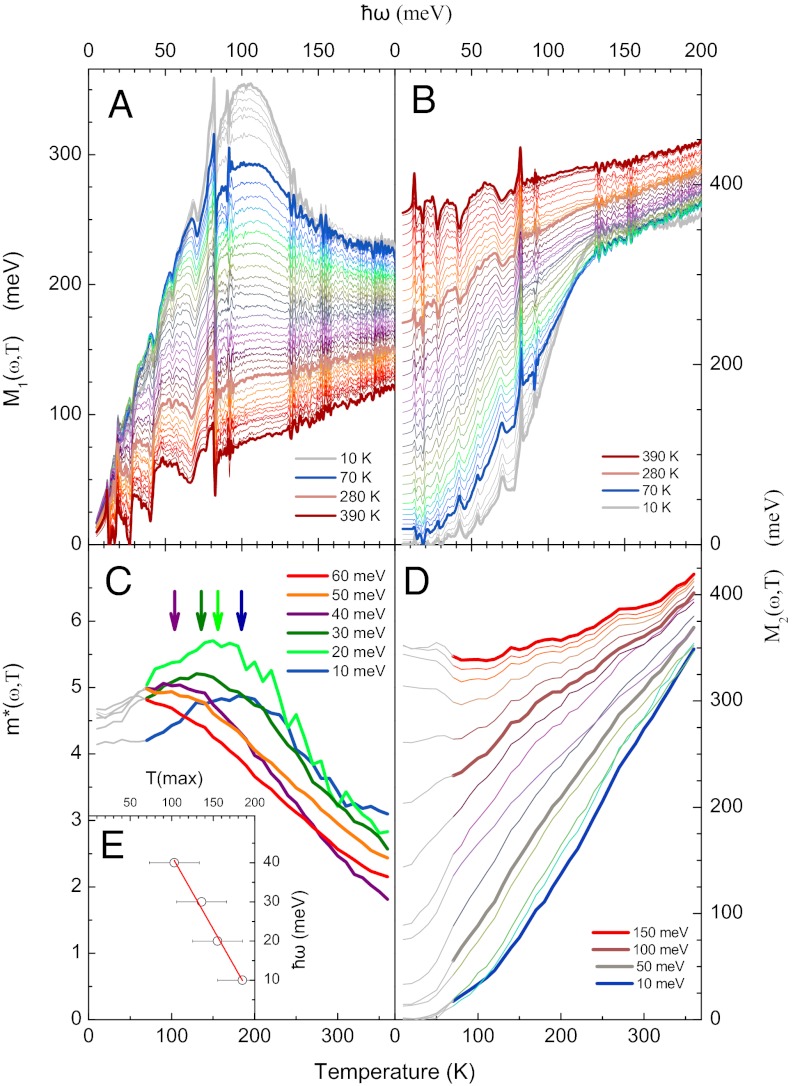
Fig. 4.
Optical self-energy as a function of frequency and temperature. (A) Real and (B) imaginary part of the memory function as a function of ℏω for underdoped Hg1201  . Spectra are shown in 10-K intervals for temperatures from 10 to 390 K. Thick lines are used to highlight the 10-, 70-, 280-, and 390-K data. (C) Effective mass
  as a function of temperature for selected values of ℏω in 10-meV intervals from 10 to 60 meV. (D) Relaxation rate
  as a function of temperature for selected values of ℏω in 10-meV intervals from 10 to 150 meV. Thick lines are used to highlight the data at selected energies. In C the approximate temperatures of the maxima T(max) are indicated with an arrow for ω with the corresponding color. (E) shows the same T(max) versus ω. The solid line is a linear fit, which extrapolates to
  for
for  . All data in the superconducting state are in gray. The temperature range (370 K) of C and D is chosen to match the frequency range of A and B (200 meV) according to the scaling relation
  .
.

