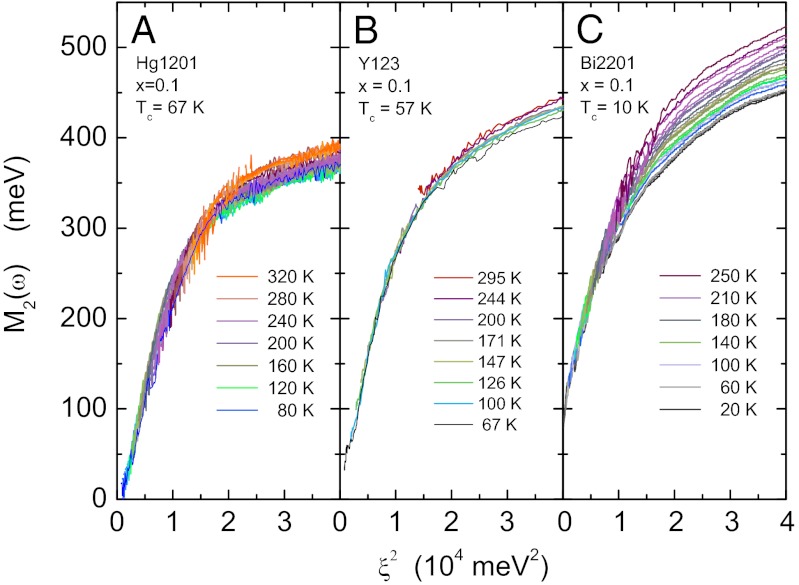
Fig. 6.
Collapse of the frequency and temperature dependence of the relaxation rate of underdoped cuprate materials. Normal state  as a function of
  with
with  . (A) Hg1201
  . (B) Y123
  , spectra by Hwang et al. (19) (digitized data of Fig. 6 represented here as a function of ξ2). (C) Bi2201
  ; data of van Heumen et al. (20) represented here as a function of ξ2. The data displayed in A and C are in 10-K intervals with color coding indicated for temperatures in 40-K steps. In between these steps the color evolves gradually as a function of temperature. In B the color coding is given for all temperatures displayed.

