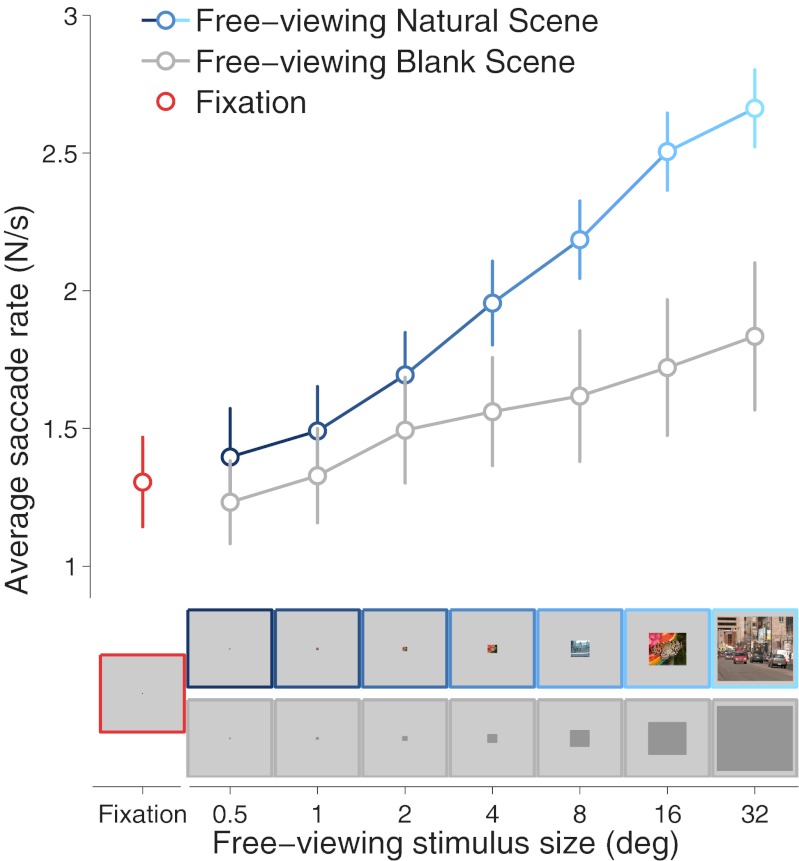
Fig. 1.
A saccadic continuum from exploration to fixation. (Upper) Average saccade rates for the different experimental conditions. Error bars represent SEM across subjects. (Lower) Examples of Natural Scene and Blank Scene stimuli, proportionally scaled down from the sizes presented in the experiment.

