
Fig. 2.
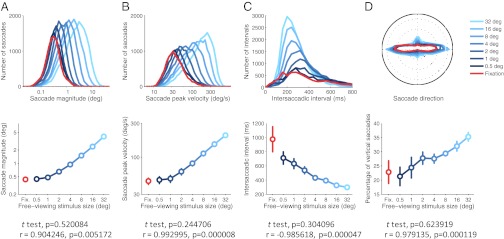
The saccadic continuum from exploration to fixation extends to saccade magnitude, peak velocity, intersaccadic interval, and direction. (A–D) Saccadic parameters in relation to scene size. (Upper) Distributions of saccadic parameters do not change in shape with decreasing image sizes, but merely shift continuously. Data from the Natural Scene condition (plots) and Blank Scene condition were equivalent. (Lower) Average saccadic parameters during fixation were indistinguishable from those during free-viewing of the smallest scene (t test P values indicated below each plot). Free-viewing regression slopes were significantly different from zero for each saccadic parameter (correlation coefficients and P values for the regression of the parameter and the logarithm of stimulus size indicated below each plot). Error bars represent SEM across subjects.