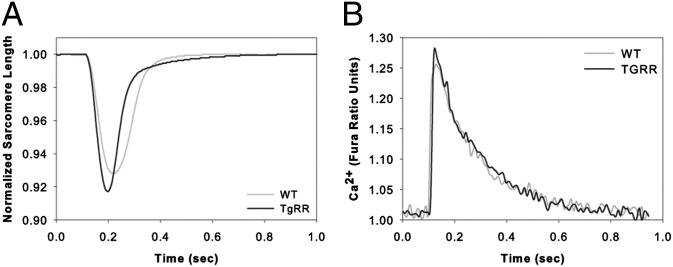
Fig. 5.
Representative sarcomere length (A) and calcium (B) traces from TgRR and WT single isolated ventricular myocytes. (A) Representative sarcomere length traces obtained using video microscopy (IonOptix). WT shortening is shown in gray and TgRR is shown in black. (B) Representative Fura-2 fluorescence traces obtained during shortening. No observable difference in calcium handling was noted. WT is shown in gray and TgRR in black. Quantification of these traces (and others) can be found in Table 2.

