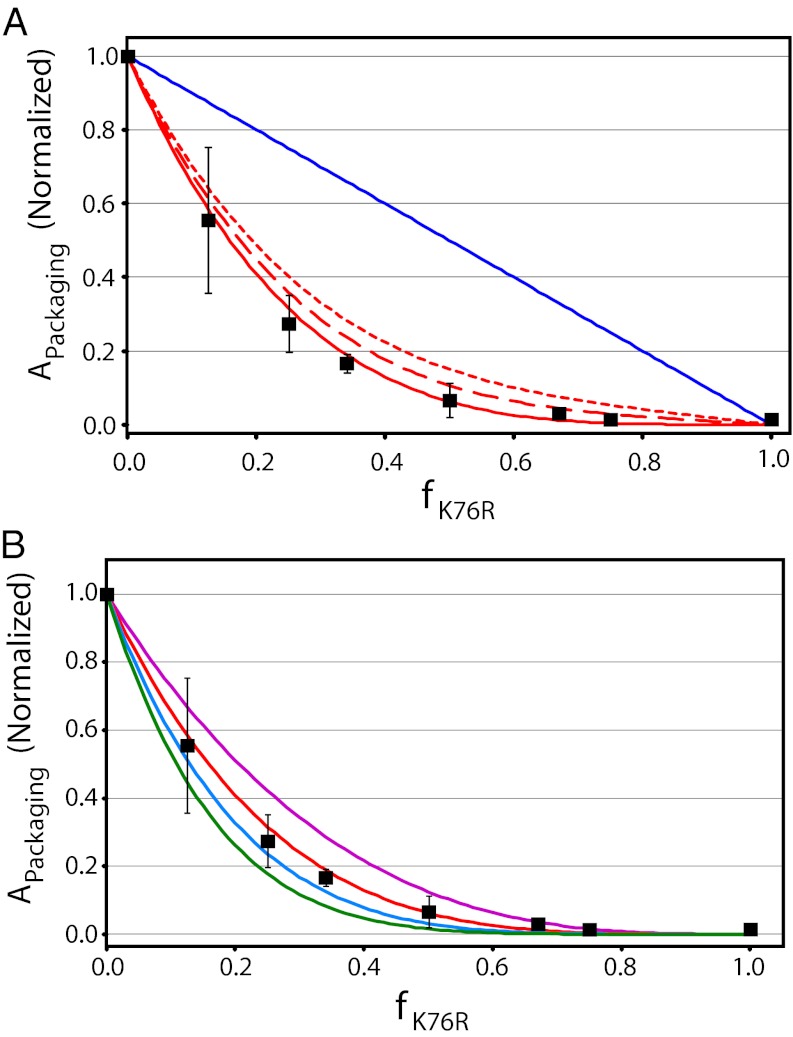
Fig. 3.
The DNA packaging motor shows strong coordination between the protomers. (A) Relative packaging activity as a function of f is indicated in black squares. Error bars represent SD (n = 3). The predicted ensemble activity of the motors in solution was calculated from Eq. 3 incorporating zero (blue line; SSE = 0.91), 100% (red line; SSE = 4.55 × 10⁻³), 90% (red dashed line; SSE = 1.98 x10⁻²), and 80% (red dotted line; SSE = 5.10 × 10⁻²) coordination in the individual motors (Fig. S2B). (B) The experimental data from A is redisplayed, and the predicted ensemble activity of motors containing three (purple; SSE = 5.65 × 10⁻²), four (red; SSE = 4.55 × 10⁻³), five (blue; SSE = 6.49 × 10⁻³), and six (green; SSE = 3.03 × 10⁻²) protomers was calculated from Eq. 3 assuming 100% coordination.

