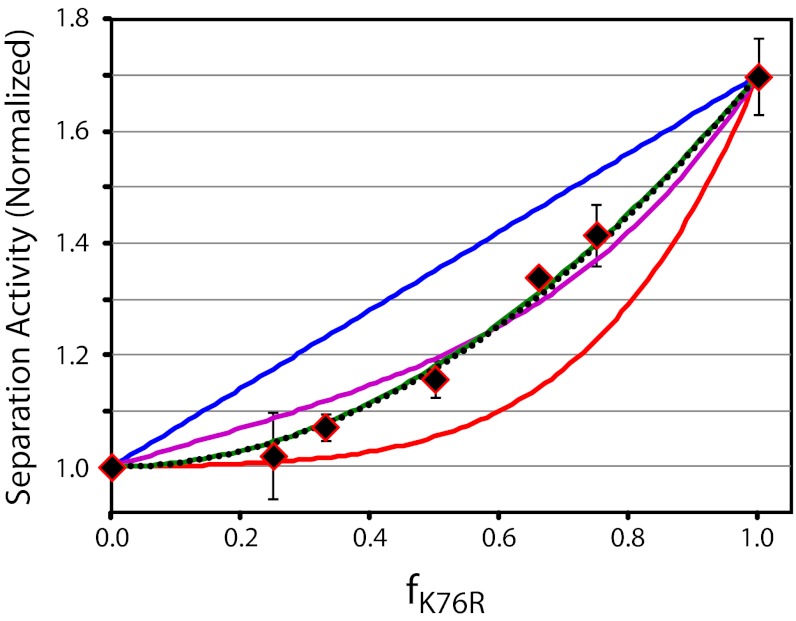
Fig. 4.
The genome maturation complex shows complex coordination. Relative strand separation activity as a function of f is indicated in black diamonds. Error bars represent SD (n = 3). The predicted ensemble activity of a symmetric tetrameric complex in solution was calculated from Eq. 3 assuming zero (blue line; SSE = 2.84 × 10⁻²), 50% (purple line; SSE = 2.99 × 10⁻³), or 100% (red line; SSE = 2.51 × 10⁻²) coordination in the individual motors (Fig. S3). The predicted ensemble activities of a simple dimer model (black dots; SSE = 5.71 × 10⁻⁴) and a dimer of dimers model (green line; SSE = 5.65 × 10⁻⁴) are shown assuming 100% coordination (Figs. S4 and S5B).

