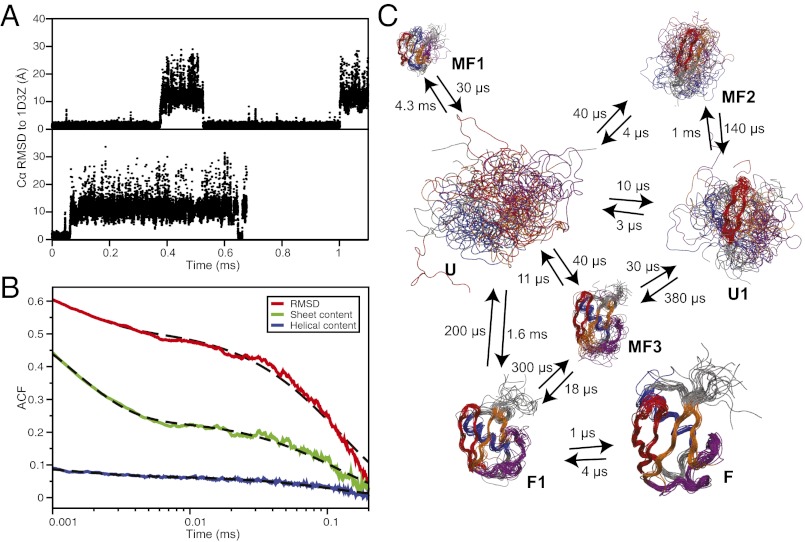
Fig. 1.
Equilibrium folding simulations of ubiquitin. (A) Traces of the Cα RMSD (for residues 2–71) from the native structure for the two simulations where reversible folding is observed. (B) Autocorrelation function of the Cα RMSD (red), the number of helical residues (blue), and the number of residues in β sheets (green). The dashed black lines are biexponential fits to the autocorrelation functions with characteristic times of ∼1.5 µs and ∼120 µs. (C) Kinetic model of the folding free-energy surface. For each state, 20 random structures are displayed, superimposed using Theseus (91), and scaled according to state population. Hairpin 1 is colored in red, hairpin 2 in orange, the α helix in blue, and the C-terminal loop containing the 310 helix and the fifth β sheet in purple. The kinetic model was obtained from an eight-state fit to the time autocorrelation function of 400 random Cα–Cα contacts (71). A higher number of states results in negligible improvement on the quality of the fit. The transition times, modified to enforce detailed balance (92), are also reported here. Two unstructured unfolded-state clusters were generated by the fitting procedure and are here merged in a single state (U) to simplify the representation.

