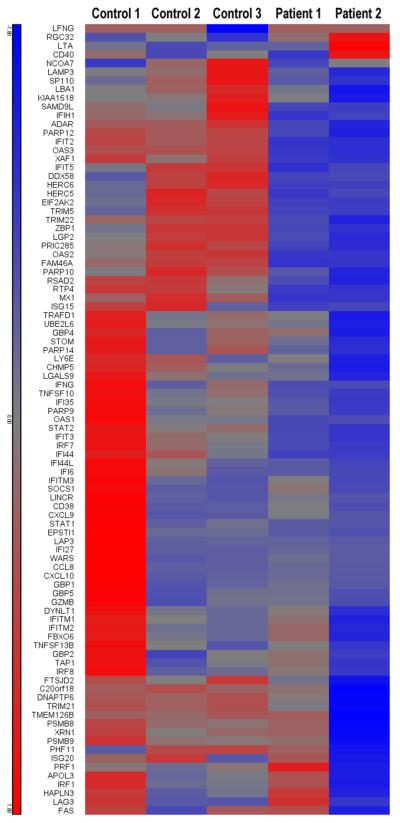
Figure 6. Heatmap of response of CMC patients and controls to Candida albicans in vitro stimulation.
In this analysis the standardized fold change gene expression in stimulated vs. unstimulated cells was calculated. The scale of this heatmap is given as standardized log2 fold change with a range from −1.8 (blue) to +1.8 (red).

